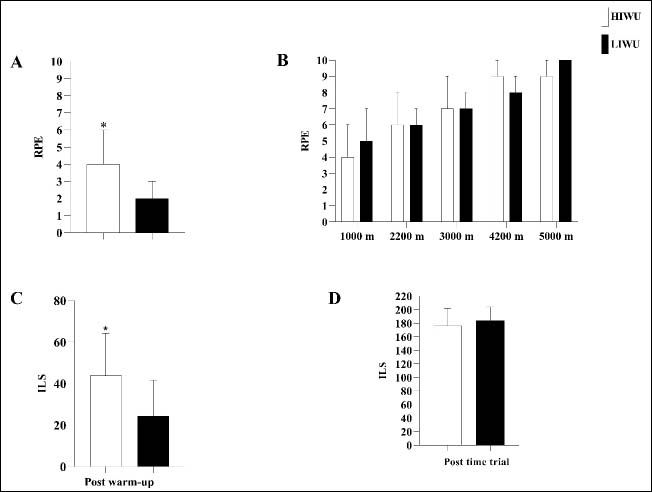
Figure 6. Values expressed as mean ± standard deviation: A) Rating of perceived exertion at post warm-up and B) Rating of perceived exertion at post 1000 m, 2200 m, 3000 m, 4200 m and 5000 m. C) Internal load of the session in the post warm-up moment. D) Internal load of the session at the moment post time trial. Values expressed as mean ± standard deviation: A) Rating of perceived exertion at post warm-up and B) Rating of perceived exertion at post 1000 m, 2200 m, 3000 m, 4200 m and 5000 m. C) Internal load of the session in the post warm-up moment. D) Internal load of the session at the moment post time trial. RPE = Rating of Perceived Exertion; ILS: Internal Load of the Session; *p<0.05 vs. LIWU.