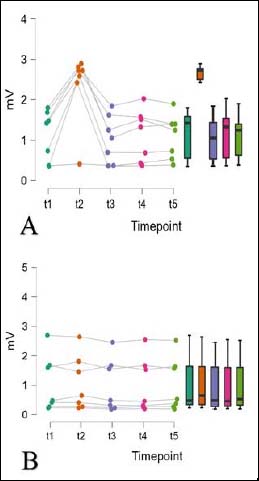
Figure 6. Peak EMG amplitude for the net-EMG at the tested time points for PAPEE (A) and PAPEV (B). Figure shows individual peak EMG values as well as a boxplot diagram for the timepoints t1 (baseline), t2 (2 seconds after CC), t3 (4 minutes after CC), t4 (8 minutes after CC) and t5 (12 minutes after CC).