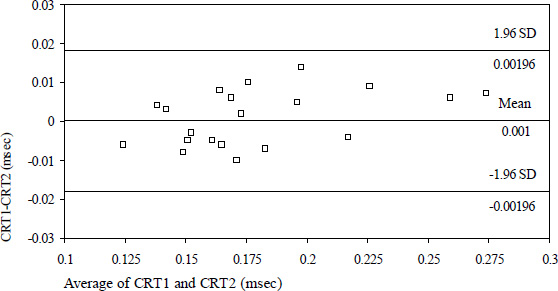
Figure 7.
Bland and Altman Plot. CRT1 = results of first session of the CRT measurement versus CRT2 = results of second session of the CRT measurement.