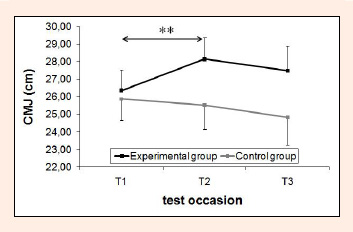
Figure 7.
Solid lines and * represent differences between evaluation moments in the experimental group. ** p < 0.01.