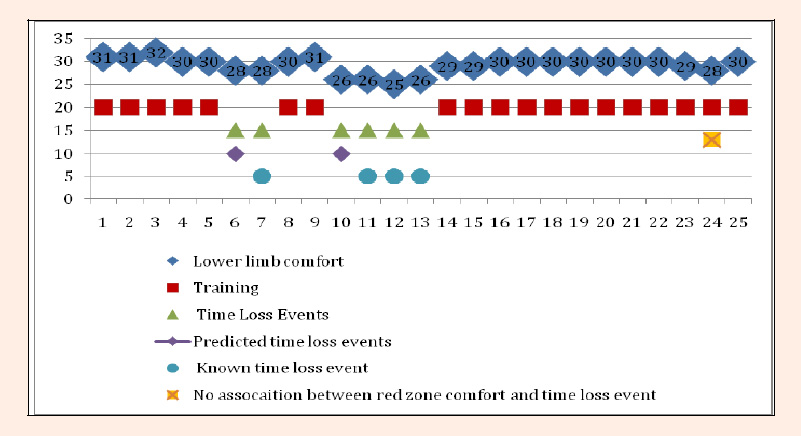
Figure 7. Shows lower limb comfort, participation in training sessions, time loss events, predicted and known injury events for one player whose data were representative of the sample. The x-axis represents player comfort weeks, 1-25; the y-axis comfort scores 0-35.