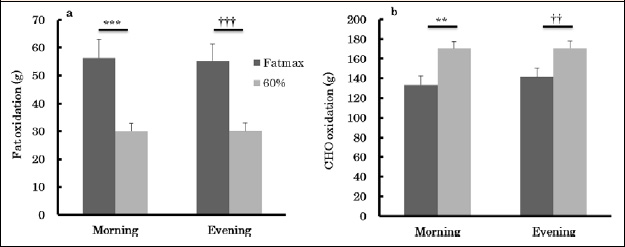
Figure 7.
Fat (a) and carbohydrate (CHO) oxidation (b) for each trial. * p < 0.01, *** p < 0.001 Fatmax vs 60%VO
2
max in the morning, † † p < 0.01, † † † p < 0.001 Fatmax VS 60%VO
2
max in the evening.