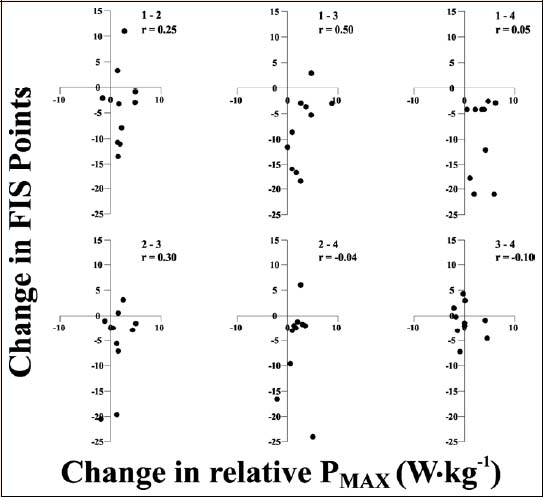
Figure 7.
Scatter plots of the comparisons of season-to-season changes in P
MAX
and FIS points for each of 4 seasons for each subject. * p < 0.05