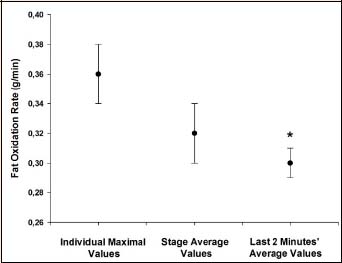
Figure 7.
Comparison of fat oxidation rates calculated from the individual maximal, stage average, and last 2 min average values of the 6 min stage. *: significantly different from the individual maximal value (p < 0.05).