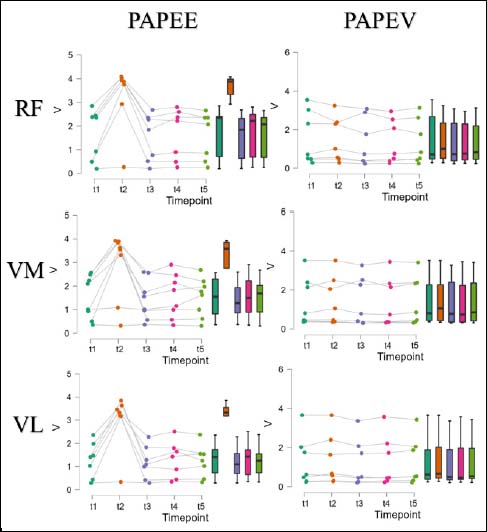
Figure 7. Peak EMG amplitude for the M. rectus femoris (RF), M. vastus medialis (VM) and M. vastus lateralis (VL) at the tested time points for PAPEE and PAPEV. Figure shows individual peak EMG values as well as a boxplot diagram for the timepoints t1 (baseline), t2 (2 seconds after CC), t3 (4 minutes after CC), t4 (8 minutes after CC) and t5 (12 minutes after CC).