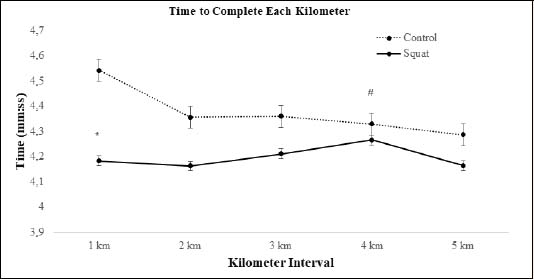
Figure 8. Representative graph demonstrating the changes seen in time to complete each kilometer during the squat and control conditions. * indicates a significant decrease in run time in the squat condition as compared to the control condition. # symbol indicates a significant interaction effect where the control condition run time was higher.