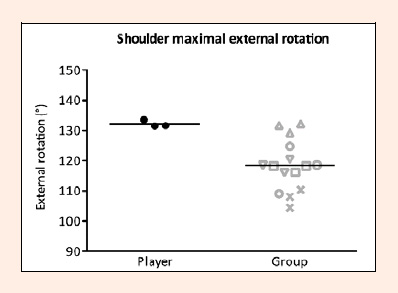
Figure 9. Maximal external rotation for shoulder. Each plot represents one of the 3 best serves of a player. Each symbol represents a different player. We express means of player and group as degree per second (°·s–1). Values for the player (n = 1; black) and the group (n = 5; grey).