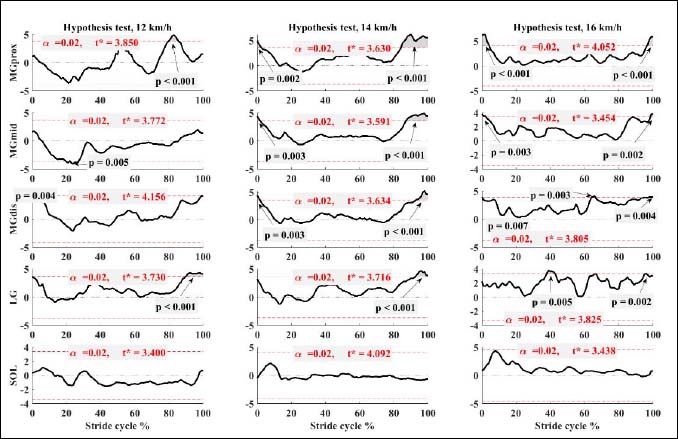
Supplementary Figure 6. Comparisons of group means and SD of the normalized electrical activity (all EMG channels averaged per muscle and normalized to maximum activity) at 12 km·h-1, 14 km·h-1, and 16 km·h-1 running speeds between forefoot (FFS) and rearfoot strike (RFS) running. Statistical Parametric Maps (SPM) show the comparisons between the foot strikes for each muscle. SPM{f} trajectories reflect the magnitude of the test statistics. When the calculated SPM{t}value crossed the critical threshold at any point or region it indicates statistically significant differences at group level. Abbreviations: FFS – forefoot strike running, RFS – rearfoot strike running.