Research article - (2009)08, 235 - 246
Kinematic Analyses of the Golf Swing Hub Path and its Role in Golfer/Club Kinetic Transfers
Steven M. Nesbit, Ryan McGINNIS
Department of Mechanical Engineering, Lafayette College, Easton, PA, USA

Steven M. Nesbit
✉ Department of Mechanical Engineering, Lafayette College, Easton, PA, USA
Email: nesbits@lafayette.edu
Received: 03-09-2008 -- Accepted: 17-03-2009
Published (online): 01-06-2009

ABSTRACT

This study analyzed the fundamental geometric and kinematic characteristics of the swing hub path of the golf shot for four diverse subjects. In addition, the role of the hub path geometry in transferring the kinetic quantities from the golfer to the club were investigated. The hub path was found to have a complex geometry with significantly changing radii, and a constantly moving center-of-curvature during the downswing for all subjects. While the size and shape of the hub path differed considerably among the subjects, a three phase radius-based pattern was revealed that aligned with distinct stages of the downswing. Artificially controlling and optimizing the hub path of the better golfer in the group indicated that a non-circular hub path was superior to a constant radius path in minimizing the kinetic loading while generating the highest possible club head velocity. The shape and purpose of the hub path geometry appears to result from a complex combination of achieving equilibrium between the golfer and the club, and a purposeful configuring of the path to control the outward movement of the club while minimizing the kinetic loading on the golfer yet transferring the maximum kinetic quantities to the club. Describing the downswing relative to the hub path phasing is presented and was found to be informative since the phases align with significant swing, kinetic and kinematic markers. These findings challenge golf swing modeling methodologies which fix the center-of-curvature of the hub path thus constraining it to constant radius motion.

Key words: Golf biomechanics, golf swing kinematics, golf swing kinetics

Key Points
  • The golf swing hub path was found to have a complex geometry with significantly changing radii, and a constantly moving center-of-curvature during the downswing.
  • The hub path differed considerably among subjects, however a three phase radius-based pattern was revealed that aligned with distinct stages of the downswing.
  • The shape and purpose of the hub path geometry appears to result from a complex combination of achieving equilibrium between the golfer and the club, and a purposeful configuring of the path to control the outward movement of the club while minimizing the kinetic loading on the golfer yet transferring the maximum kinetic quantities to the club.
Subjects

Four amateur golfers, three males and the one female had their golf swings analyzed for this study. All subjects are right-handed and their relevant data are given in Table 1. A diversity of skill levels and swing styles was the criteria for selecting these subjects in an attempt to yield a range of results (Nesbit and Serrano, 2005; Nesbit, 2005). Stylistically, the male scratch and male 5H subjects had aggressive, powerful, and quick swings, whereas the male 13H and female 18H subjects had smoother, longer, and slower swings. All subjects used the same club (driver of length = 1.092 m; mass = 0.382 kg; cg location from top of club = 0.661 m; ICG = 0.07104 kg·m2). Informed consent for the following procedure was obtained from all subjects. Each subject had reflective markers placed upon their body. A rigid triad of markers was attached to the club near the top of the shaft. The Motion Analysis system was calibrated until the combined 3D residual for all cameras was under 1.00 mm (Test/retest of static marker locations varied by less than 0.20 mm for a given calibration.) The subjects were asked to execute a series of swings that included hitting a ball into a net. The subjects were advised to swing the club in a manner similar to hitting a driver in a competitive situation where distance and accuracy were both important. The subjects were instructed to practice swinging the club as many times as necessary until they became comfortable with the testing situation and felt they could swing “normally ”and consistently. Subsequently, several swings from each subject were recorded and tracked then presented to the subjects for their review. It was found that the club head velocities were consistent among the acceptable trials within a maximum range of 5% for all subjects. The subjects each selected what they considered to be their most representative swing in terms of club head velocity, impact feel, partial flight of the ball, and overall visual assessment of the motion capture data. This single self-selected swing from each subject was then analyzed for this study. This manner of conducting trials and selecting swings for subsequent analyses is consistent with previous studies (Nesbit and Serrano, 2005; Nesbit, 2005).

Subject Swing Data

Much of the kinematic and kinetic data output by the computer model (Table 2) have been previously reported. There appears to be sufficient agreement with published data to yield confidence in the model output. The range of the kinematic and kinetic quantities among the subjects is considerable and quantitatively emphasize the differences in their swing mechanics, a finding supported by Nesbit, 2005. Referring to Figure 2 the individual characteristics of the subjects’ swing are evident. Of note is the individual nature of the inner hub path, its non-constant radius, and shifting center of rotation for all subjects. Thus the goal of analyzing a diverse set of swing styles from a mechanics point of view was achieved.

Hub Path Geometry

Figure 3 demonstrates that there are considerable differences in the size, shape, changing radii, and shifting center-of-curvature of the hub path among the subjects. Williams, 1966 reported an “average ”hub radius of 0.67 m for one subject which is within the range for all subjects. Figure 4 illustrates that that the radius of the hub path changes significantly during the downswing, and that the minimum, maximum, and range of radii values for the subjects vary considerably. However there appears to be a pattern associated with the changing hub radius. For all subjects, the local maximum radii occur near the top of the backswing (0.665, 0.649, 0.842, 0.629) m and near ball contact (0.793, 0.581, 0.979, 0.874) m, and the local minimum value occurs at the midpoint in the downswing (0.535, 0.408, 0.397, 0.460) m and at ball contact (0.322, 0.310, 0.145, 0.413) m. All subjects exhibit a sharp reduction in radius near ball contact as identified by Miura, 2001 which has been related to skill level (Nesbit, 2005). The movement of the center-of-curvature exhibits the same three-phase pattern among the subjects which coincides with the max/min’s of the hub path radius. For the male scratch subject, from the initiation of the downswing until the hands are halfway around the swing hub (9:00 position), the center-of-curvature moves sharply to the golfer’s right and slightly upward (Phase I - Figure 5a). The club remains fairly close to tangent to the path during this phase as the golfer is primarily pulling the club along the hub path. Here, the radius of the hub path starts at a local maximum and decreases during the entire phase to its first local minimum. Phase II (Figure 5b) begins with the hands at the 9:00 position and continues to near the 7:00 position. During this phase the center-of-curvature moves downward and to the golfer’s left as the path radius increases continuously to its second local maximum value. This phase sees considerable outward movement or un-cocking of the club relative to the path. During Phase III, which takes the club to ball contact (Figure 5c), the center of curvature moves sharply downward as the path radius decreases to its minimum value at ball contact Here, the club continues to move outward relative to the path and becomes perpendicular to the path at ball contact. A three-phase delineation of the downswing is presented by Miura, 2001 which loosely corresponds time-wise with this demarcation, however it is based upon relative wrist movement, arm rotation, and energy transfer, not hub path characteristics.

In the discussions that follow, the reader should refer to Figures 5a, b, c to relate the phases to the relevant portion of the downswing, and note that the quantities in parentheses are for the subjects as follows: (male scratch, male 5H, male 13H, and female 18H).

Hub Path Velocity and Acceleration

The maximum hub path linear (grip) velocities were found to be very similar among the subjects (11.5, 11.1, 11.2, 11.3) m·s-1. For all subjects, the velocity increased significantly during the first phase + (39.7, 37.4, 38.0, 42.8)%, but more rapidly during the second phase +(60.3, 62.6, 62.0, 53.4)%. A slight but distinct increase in the slope of the velocity profile was evident at the transition between phase I and phase II for all subjects. The increasing path radius during phase II appears to enhance the rate of increase in hub velocity. Three of the four subjects reached their peak grip velocity values at the end of the phase II. The grip velocity remained nearly constant during phase III for the male scratch subject, reduced slightly for the male 5H and male 13H subjects, and increased slightly for the female 18H subject.

Relationships between the linear acceleration components of Equations (5) and (6), and hub radius phases can be better identified when the accelerations are resolved into tangential and normal components. Referring to Tables 2, 3">3, 4">4, 5">5, 6">6, the maximum hub path (grip) acceleration magnitudes (201, 199, 210, 185) m·s-2, maximum tangential components (58.6, 53.7, 50.9, 48.6) m·s-2, and maximum normal components (196, 195, 206, 183) m·s-2 indicated some differences among the subjects. The differences in the maximum tangential acceleration values were a result of the relative smoothness of their swings which had little effect on the maximum hub path velocities. The tangential component of the hub path accelerations had similar phase related characteristics as hub path velocity. The tangential acceleration was initially (6.7, 5.9, 11.3, 17.4)% of maximum, increased during phase I + (30.4, 35.5, 32.3, 31.0)%, and reached (37.1, 41.2, 43.5, 48.4)% by the end of the phase. During phase II, the tangential acceleration increased at a greater rate +(62.9, 58.8, 56.5, 51.6)% and reached 100% of maximum at the end of the phase for all subjects. Here again, the increasing path radius during phase II appears to enhance the rate of increase in tangential acceleration. The tangential acceleration dropped during phase III and reached (0, -12.1, -11.7, 14.5)% of maximum at ball contact. These values imply that a relative delay then more rapid increase of the tangential acceleration is desirable.

The differences in the profiles and maximum values of the normal acceleration for the subjects resulted primarily from differences in the hub path radius profiles since the velocity profiles were similar. For all subjects, the normal acceleration increased during all phases; + (32.4, 30.2, 35.8, 46.7)% during phase I, + (34.5, 41.7, 27.4, 33.4)% during phase II, and + (33.1, 28.1, 31.8, 19.1)% during phase III. Three of four subjects reached 100% of their maximum normal accelerations at ball contact (the female 18H subject reached 99.2%). The increase during phase III was a result of the significant reductions in hub radii for all subjects since their linear velocities were relatively constant during this phase. The normal acceleration was (nearly) maximum at ball contact for all subjects even in cases when hub path linear velocity was not maximum. This occurrence was a result of all subjects reaching a local minimum radii at ball contact. The rate of increase of normal accelerations was fairly uniform over the three phases for three of the subjects. This uniformity requires a complex interaction between hub path velocity and radius during the downswing.

Hub Path Interface Kinetics: Torque

The maximum swing torque values differed considerably among the subjects (42.1, 36.8, 24.6, 24.0) Nm. All subjects initiated the downswing with a relatively high percentage of their maximum swing torque (44.6, 29.7, 28.8, 16.3)%. The subjects increased their swing torque over phase I + (31.4, 37.0, 58.3, 67.9)% reaching (66.0, 66.7, 87.1, 84.2)% of maximum at the end of the phase. Even though the swing torques were relatively high during phase I, there was little outward movement of the club relative to the hub path. The low club handle velocity coupled with the initial large hub path radius minimized the centrifugal loading on the club thus reducing the tendency of the club moving outward. The subjects further increased their torque over phase II + (24.0, 33.3, 12.9, 15.8)% and all reached 100% of maximum torque at the end of the phase. For all subjects, the initiation of phase II coincided with their first local hub radius minimum, while applying the majority of their respective maximum swing torque, and reaching about half of their respective maximum grip velocity. Acting together these effects increased the centrifugal loading on the club and initiated the rapid outward or uncocking movement of the wrists/club relative to the hub path. During phase II, as the club moved outward, the wrist torques continued to increase accelerating the angular motion of the club. The increase in hub path radius during this phase may be a result of the golfer shifting the effort from controlling the hub path to applying maximum wrist torque, or it could simply be a third-law reaction to the rapid outward movement of the club. During phase III, all subjects experienced a significant reduction in swing torque -(100, 91.8, 72.4, 65.5)% and reached (0, 8.2, 27.6, 34.4)% of maximum at ball contact. During phase III when the hub radius reduced rapidly, the wrist torques decreased toward zero at ball contact. During this phase, the wrist torques continued to contribute somewhat to the acceleration of the club.

Hub Path Interface Kinetics: Force

Relationships between the linear force and hub radius phases can be better identified when the force is resolved into its tangential and normal components (see Figure 6). The maximum value of the linear force (512, 453, 390, 304) N, the tangential component maximum (248, 218, 187, 154) N, and the normal component maximum (477, 422, 375, 277) N showed considerable differences among the subjects. For all subjects, the maximum normal force component exceeds the maximum tangential force component by nearly a two-to-one ratio. Thus the golfer exerts considerably more effort in controlling the path of the club than linearly accelerating the club. The direction of the linear force is initially tangent to the path and at ball contact is normal to the path. Thus the direction of the force moves progressively inward relative to the hub path as the downswing progresses. At the end of phase I, the direction of the force is still mostly tangent to the path. By the end of phase II, the direction is about 45 degrees inside the hub path, and by the end of phase III, it is normal to the hub path.

The tangential component is initially (12.3, 10.3, 6.6, 4.9)% of maximum and increased + (41.0, 49.0, 56.7, 66.7)% and reached (53.3, 59.3, 63.3, 71.6)% of maximum at the end of phase I. The tangential force continued to increase during phase II + (46.7, 40.7, 36.7, 28.4)% and all subjects reached 100% of maximum at the end of phase II. During phase III the tangential force drops rapidly - (100, 93.3, 96.7, 92.2)% and reached (0, 6.7, 3.3, 7.8)% of maximum at ball contact. The normal component which is initially zero increased during all three phases; + (7.7, 14.2, 16.2, 23.7)% during phase I, + (16.1, 17.1, 22.1, 27.8)% during phase II, and +(75.7, 68.7, 61.7, 48.5)% during phase III. All subjects reached 100% of maximum at ball contact.

The function of the linear force appears to change as the downswing progresses. During phase I, the majority of the force is tangent to the path and primarily functions to accelerate the club. The subjects apply the majority of their respective maximum tangent force by the end of phase I while applying little of their respective maximum normal force in controlling the hub path. Only modest effort is required to reduce the path radius during this phase because of the low club velocity. The tangential force continues to increase during phase II and reaches maximum at the end of the phase which coincides with the subjects reaching their local maximum radii. During this phase the normal force increases more slowly and reaches between a quarter and half of maximum by the end of the phase. Even though the club head velocity is quite high at this point (86.4-92.6% of maximum), the increasing value of the hub radius and the angular position of the club relative to the hub path diminish the centrifugal force loading from the club. The function of the linear force during this phase transforms from simply accelerating the club to simultaneously accelerating the club, controlling the path, and reacting to the centrifugal loading of the club. During phase III the tangential force drops toward zero while the normal force increases to maximum values at ball contact. The primary action of the linear force during this phase is controlling the path and reacting to the large centrifugal loading from the club as it reaches its maximum club head velocity and coincident minimum hub radius. The rapidly reducing hub path radius nearing ball contact assists in transferring energy to the club even though the direction of the force is nearly perpendicular to the direction of the club head velocity (Miura, 2001).

Hub Path Interface Kinetics: Work and Power

The work (and power) done on the club by the golfer during the downswing is resolved into linear and angular contributions (see Equation (7). The linear work comes primarily from the action of the arms and the angular work from the action of the wrists (Nesbit and Serrano, 2005).

There were significant differences in total work (355, 289, 288, 235) Nm and linear work (206, 155, 140, 114) Nm among the subjects. The angular work was more consistent (146, 134, 148, 121) Nm. The ratio of linear work to angular work for the subjects was (1.41, 1.16, 0.95, 0.94) which highlights the relative use of the arms/wrists in doing work on the club. During phase I the subjects generated (35.5, 37.3, 50.1, 60.4)% of their total work, which consisted of (58.5, 53.3, 44.6, 54.5)% of their linear work, and (17.6, 21.7, 56.3, 69.0)% of their angular work. During phase II, the subjects increased their total work by + (39.0, 47.9, 33.2, 34.1)%, of which the linear work increased by + (32.9, 43.1, 41.5, 42.7)%, and the angular work increased by + (69.7, 72.5, 23.6 26.4)%. There were smaller addition amounts of work done during phase III. Total work increased by + (10.5, 4.8, 16.7, 3.5)%, of which the linear work increased by + (8.6, 5.6, 13.9, 2.8)%, and the angular work increased by + (12.7, 3.8, 20.1, 4.6)%. All subjects reached 100% of their total, linear, and angular work at ball contact.

All subjects did the most linear work during phase I which emphasizes the importance of the arms in accelerating the club during this portion of the downswing. During this phase, the relative high value of the linear displacement combined with moderate values of the tangential force yielded the high value of linear work. All subjects continued to do positive linear work through phase II though not as much as during phase I. Here the tangential forces became maximum, however they were applied to only about 30% of the hub path. The small amount of additional linear work done during phase III reflects the rapidly diminishing tangential force and small linear displacement during this phase. The majority of the angular work was done during phases I and II for the subjects which emphasizes the importance of the wrists in accelerating the club during these phases of the downswing. The angular work results from the combined effects of swing torque applied over the angular displacement of the club. These results reveal the effectiveness of the male scratch and male 5H subjects in delaying the outward movement or uncocking of the club through coordinating the timing of their swing torques with the radius profile of the hub path which has been shown to yield higher club head velocities (Nesbit, 2005). The additional angular linear work done during phase III was significantly lower than for phases I and II (except for the male 13H subject), and reflects the rapidly diminishing swing torque and small angular club displacement during this phase.

There were large differences among the subjects in total power (3875, 3005, 2310, 1720) Nm·s-1, linear power (2775, 2316, 1402, 1188) N.m/s and angular power (1150, 890, 1078, 698) Nm·s-1, as well as in the ratio of linear power (arms) to angular power (wrists) (2.41, 2.60, 1.30, 1.70). Starting from zero power, the total power reached (30.6, 26.7, 45.2, 51.0)% of maximum, the linear power reached (37.6, 34.1, 44.9, 55.5)% of maximum, and the angular power reached (22.0, 19.6, 47.2, 47.0)% of maximum at the end of phase I. During phase II, the subjects increased their total power by + (69.4, 73.3, 54.8, 49.0)%, their linear power by + (62.4, 65.9, 55.1, 44.5)%, and their angular power by + (78.0, 80.4, 52.8, 53.0)%. By the end of phase II, all subjects had reached 100% of their maximum total, linear, and angular power. During phase III, the power dropped rapidly, and at ball contact the total power was (0, 0, 5.2, 8.8)% of maximum, linear power was (0, 0, 2.1, 6.0)% of maximum, and angular power was (0, 0, 11.3, 14.8)% of maximum.

Phase II appears to be the most important portion of the downswing relative to power generation. All subjects are at peak power output the end of phase II thus applying maximum effort in accelerating the club (both linearly and angularly) at this point in the downswing. This peak coincides with the subjects reaching a local maximum hub radius. It would seem logical that an increasing radius during this phase would reduce the effort required to control the path, thus making more effort available to the golfer to generate power thus enhancing the kinetic transfer from the golfer to the club.

Club Head Velocity

Maximum club head velocities differed significantly among the subjects (52.0, 49.7, 46.3, 42.1) m·s-1. The subjects generated (30.3, 32.2, 37.5, 46.5)% of their maximum club head velocity during phase I. During phase II the subjects increased their velocity by + (60.1, 56.3, 48.9, 46.1)% reaching (90.4, 88.5, 86.4, 92.6)% of their maximum by the end of the phase. The subjects further increased their club head velocities during phase III by + (9.6, 11.5, 13.6, 7.4)% and all subjects achieved 100% of maximum at ball contact. All subjects showed an increase in club head velocity during the entire downswing. The rate of velocity increase transitions from phase I to phase II for three of the subjects (the female 18H subject sees a uniform increase over the two phases). At this point in the downswing, the slope of the velocity curve shows a relatively sharp increase which expected since this change in phase coincides with the initiation of the outward movement of the club. At the transition from phase II to phase III, the club head velocity begins to level off as it reaches its maximum value at call contact. The specific effects of hub path radius on club head velocity are difficult to isolate since club head velocity represents a summary of the effectiveness of the golfer in generating and transferring energy through the various kinetic quantities to the club which individually are related to the hub radius to different degrees as discussed.

Hub Path Modification and Optimization for Scratch Golfer

In an effort to better understand the role of the hub path in the golf swing, modifications were made to the hub path of the scratch golfer and the effects upon the club head velocity and kinetic quantities were determined. Two hub path modifications were analyzed then compared to the original swing. First, the hub path was constrained to follow a constant radius path set at the average (0.58 m), larger than the average (0.68 m), and smaller than the average radius (0.48 m) for this subject (The average radius was determined by matching the original swing club head velocity using a constant radius hub path). The swing was kinematically controlled to execute the original swing with the exception of the altered hub path. Second, an optimum hub path was searched for within the band of possible hub paths constrained by the maximum and minimum radial values exhibited by the subject. Once a hub path “trial ”was selected within the band, the swing was again kinematically controlled to execute the original swing with the exception of the altered hub path. The goal of the optimization was to identify the hub path that yielded the highest club head velocity. A constraint on the optimization was that none of the kinetic values (force, torque, work, and power) from the original subject swing could be exceeded.

The results of the constraining the hub path to constant radius motion are presented in Table 7 (the quantities in parentheses are the percent change in values relative to the original swing). Constraining the hub path to the average constant radius resulted in an increase in the swing torque, power, and work, and a decrease in the linear force necessary to execute the swing at the original club head velocity. Increasing the (constant) radius of the hub path has a beneficial effect upon club head velocity for this subject (+6.5%). However the cost of this modification is an enormous increase in the required kinetic quantities necessary to execute this swing. Reducing the (constant) radius of the hub path resulted in a considerable reduction in club head velocity (-10.5%). There is an associated reduction in all kinetic quantities required to execute this swing. For a constant radius hub path, the timing of the maximum torque and power occur later in the downswing compared to the original hub path. The maximum linear force and work still occur at ball contact.

The optimization algorithm searched through 80 million iterations in identifying a hub path for this subject that yielded an increased club head velocity (+4.1%) with equal or lower kinetic quantities to execute (Figure 7). With the exception of the very top portion of the downswing, the radius of the optimized hub path exhibited the same three-phase pattern as for the hub path of the original swing. The range of hub path radii for the optimized hub path was greater than for the original swing. In addition, the reduction in radius at ball contact started sooner (-0.01 sec for the optimized swing verses -0.04 sec for the original swing). This action had the effect of reducing the slope of the radius curve which controlled the magnitude of the linear force, the limiting kinetic parameter for this subject. For the optimized hub path, there is a reduction in maximum swing torque, work, and power. For this case, the timing of the maximum torque and power occur slightly earlier in the downswing while the maximum linear force and work still occur at ball contact.

INTRODUCTION

Golf is one of the most popular of recreational sports with some 55 million participants throughout the world (Farrally et al., 2003). However, the golf swing is one of the most difficult and complex of sport motions (Dillman & Lange, 1994). Much research has been applied to the biomechanical analysis of the golf swing in an effort to understand the complex mechanics of the motion in order to provide a basis for improving performance (Hume et al., 2005) and aiding club design (Thomas, 1994).

One aspect of the golf swing that has received little biomechanical consideration is the path of the hands. This path herein referred to as the hub path, is the point where the summation of the forces, torques, energy, and momentum developed within the golfer through the various joint and body movements are ultimately transferred to the club. Traditional biomechanical analyses of the golf swing treated the path of the hands as simple circular motion. In addition, the contribution of this path to the function and efficiency of the golf swing has been overshadowed by the role of the wrists (Cochran and Stobbs, 1969). The subtle non-circular nature of the hub path has been recognized since the early days of golf biomechanical study (Cochran and Stobbs, 1969; Williams, 1966). However for the majority of golf biomechanical studies, the hub path has been modeled as a constant radius path via the two-link “double pendulum ”system thus potentially concealing and/or diminishing its role in the golf swing (Budney and Bellow, 1979, 1982; Cochran and Stobbs, 1969; Jorgensen, 1970; Lampsa, 1975; Milne and Davis, 1992; Vaughn, 1981; Williams, 1966). The simplicity of the double pendulum model, its apparent accuracy, and the ease in deriving and solving the associated equations of motion were the benefits of the this modeling approach which outweighed any potential loss in representation or accuracy and since the non-circular aspect of the hub path was not considered an important component of the golf swing.

Recent work has suggested that the non-circular aspect of the hub path may have an important role in the golf swing. Nesbit, 2005 using a full-body modeling approach, determined that the hub path deviated considerably from constant radius motion. The study found that the ratio of the radius of the path at the top of the backswing to the radius at impact correlated strongly with skill level. Miura, 2001 studied the effects of the inward pull action of the golf club at impact and determined that this action increased the energy transfer to the club and the resulting club head velocity. Miura also determined that this action was a characteristic of a skilled golfer.

It is hypothesized the hub path is geometrically complex yet purposefully and uniquely configured, and that the non- circular aspect of the hub path is integral to the control of the club trajectory, the generation of maximum club head velocity, and the transference of the kinetic quantities generated by the body to the club. Thus the objectives of this study are to analyze and describe the geometric and kinematic characteristics of the hub path of the golf swing, and to determine the particular functions of the hub path geometry in transferring the force, torque, work, and power generated by the golfer to the club. The approach taken in this study is to comprehensively analyze, interpret, and present the results for a small group of diverse subjects. This limited subject, yet in-depth approach aims to describe and understand the phenomena, compare/contrast quantities among subjects, and identify quantities that may be fundamental to the golf swing (Nesbit and Serrano, 2005; Nesbit, 2005). Analyzing a large pool of subjects and performing a subsequent statistical analysis of the phenomena is beyond the scope of this study.

METHODS

Figure 1 illustrates the free-body-diagram of the model used to perform this study. The model with representative mass and inertia properties, constrains the swing to one non-moving plane (Colman and Anderson, 2007), ignores rotations about the club shaft, and treats the shaft as rigid. These simplifications are consistent with the majority of biomechanical models of the golf swing (Budney and Bellow, 1979; 1982; Cochran and Stobbs, 1969; Jorgensen, 1970; Lampsa, 1975; Neal & Wilson, 1985; Williams, 1966; Vaughn, 1981), however an important distinction is that this model does not constrain the hub path to follow a circular arc.

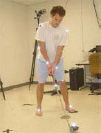
The X-Y coordinate system is in the plane of the swing and fixed to the ground (global coordinate system). The N-T coordinate system (local coordinate system) is attached to, and moves with grip point A along the hub path, and orients normal to the path pointing towards the center of curvature (N-component), and tangent to the path in the direction of motion (T-component).

The following equations of motion were developed from Figure 1:

The acceleration of the club mass center is given by the following relative acceleration vector expression:

This equations yields the following scalar components in the X and Y directions:

Data to kinematically drive the model are obtained from subject golf swings. A motion capture system (Motion Analysis Corporation, Santa Rosa, CA, USA) with eight Falcon HR 240 cameras and Eva 6.02 software is used to collect and process data from the golfers’ swings. The system tracks passive-reflective markers that are placed on the golfer and the club. Only the data from the markers on the club are necessary to drive this model. The three markers on the club are arranged in a rigid triad that is attached to the shaft just below the handgrip. Two of the markers are aligned with the long axis of the club shaft, and the third is offset perpendicular to the club shaft and parallel to the club face (see Figure 1). The three-dimensional marker triad paths are recorded at 200 Hz then smoothed and processed to yield global body 1-2-3 angular motions of the club and the three-dimensional global positions of the hub path using methods described in Nesbit, 2005. The orientation of the swing plane (X-Y plane) during the downswing is established from the angular motion data (Coleman and Rankin, 2005). The global position data of the hub path and global orientation of the club are mapped onto this plane using methods described in Kane et al., 1983 to yield the X and Y position data of the hub path and the swing angle of the club γ within the swing plane.

Numerical differentiation of the swing plane linear and angular position data yields the linear acceleration of the hub path (AAX and AAY), and angular velocity and acceleration of the club (γ and γ) (Dean and Nesbit, 1988). From this information, AGX and AGY are completely specified from Equations (5) and (6) for the duration of the swing. With the accelerations of the club specified, Equations (1) through (3) are solved to determine the time histories of the applied linear force (FX and FY) and the swing torque (T). Note that the linear force and hub accelerations are also resolved into normal and tangential components since these components align well with the changing direction of the hub path (normal component) and changing speed along the hub path (tangential component).

From the linear force components and swing torque at the club handle, the total work done by the golfer on the club is determined from the following:

Where i indicates the value of the quantity at point i in the hub path, and the ∆ function indicates a change in the associated quantity from hub point i to i + 1. The total power is determined by numerically differentiating the work expression of Equation (7). The total work and power quantities are comprised of the contributions from the linear force (linear work and power) and swing torque (angular work and power).

RESULTS

Superimposed illustrations of the subject swings are shown in Figure 2. The swing is shown starting from thetop of the backswing through a significant portion of the follow through. Each frame represents 0.01 seconds. The kinematic and kinetic quantities predicted by the model that are of interest for this study are given in Table 2 for all subjects. The data represent the maximum values that occurred during the downswing. The table also gives the relevant references for previously reported data where applicable. Note that herein after club/ball impact will be referred to as ball contact to avoid confusion with the swing phases (defined below).

The hub path during the downswing for all subjects is shown in Figure 3. The radius of the hub path as a function of time before ball contact is shown in Figure 4. The downswing is considered in three separate phases based upon the relative max/min values of the hub path radius for each subject (these phase are discussed further in the following section). Referring to Figure 4, phase I starts with the initiation of the downswing which generally corresponds to the first local radius maximum, and ends with the first local radius minimum roughly halfway through the downswing. Phase II goes from the first local radius minimum to the second local radius maximum near ball contact. Phase III goes from the second local radius maximum to ball contact. These three phases of the downswing are shown for the scratch golfer in Figures 5a, b, c. The figures also show the path and direction of movement of the center-of-curvature.

Tables 3, 4">4, 5">5, 6">6 give the normalized kinematic and kinetic data for the subjects during the downswing broken down into their respective swing phases. The data are normalized to a percentage of the maximum value experienced during the downswing (see Table 2). The percent change refers to the difference in the value from the beginning to the end of the phase. Note that not all quantities were initially zero at the beginning of phase I.

DISCUSSION

The following discussions are limited to the downswing portion of the golf swing. Grouped numerical quantities given in parentheses are for the male scratch, male 5H, male 13H, and female 18H subjects respectively and +/- indicates overall increase/decrease.

CONCLUSION

Analysis of the hub path during the downswing found that it is geometrically complex, deviates significantly from a constant radius path, exhibits a continuously changing radius, and experiences considerable movement of the center-of-curvature. While the size and shape of the hub path differed considerably among subjects, a three phase pattern emerged that was based upon path radius max/mins, that aligned well with distinct stages of thedownswing. Significant markers, relative changes, and trends in the kinematic and kinetic quantities occurred within these specific phases of the hub path. Describing the downswing relative to the hub path phasing was found to be logical and informative.

The shape of the hub path appears to result from a complex combination of achieving equilibrium between the golfer and the club, and a purposeful configuring of the path to control the outward movement of the club while minimizing the kinetic loading on the golfer yet transferring the maximum kinetic quantities to the club. Artificially controlling and optimizing the hub path of the better golfer in the group indicated that a non-circular hub path was superior to a constant radius path in minimizing the kinetic loading while generating the highest possible club head velocity.

This results presented in this study support the notion that the non-circular nature of the hub path is fundamental to the golf swing, and properly configured an essential element in achieving the maximum transfer of energy from the golfer to the club. These finding have important implications for golf instruction, and possibly for equipment design (achieving variable equilibrium paths) and injury prevention (minimizing kinetic loading).

ACKNOWLEDGEMENTS

Funding for this project was provided by a grant from the National Science Foundation.

AUTHOR BIOGRAPHY
     
 
Steven M. Nesbit
 
Employment:Professor of Mechanical Engineering, Lafayette College, Easton, PA, USA.
 
Degree: BS, MS, PhD Mechanical Engineering.
 
Research interests: Biomechanics, mechanisms, computer modeling.
  E-mail: nesbits@lafayette.edu


Ryan McGINNIS
 
Employment:PhD Graduate Student, University of Michigan
 
Degree: BS Mechanical Engineering.
 
Research interests: Biomechanics.
  E-mail: mcginnir@lafayette.edu


REFERENCES
Budney D.R., Bellow D. G. (1979) Kinetic analysis of a golf swing. Research Quarterly 50, 171-179.
Budney D.R., Bellow D. G. (1982) On the swing mechanics of a matched set of golf clubs. Research Quarterly 53, 185-192.
Cochran A., Stobbs J. (1969) The search for the perfect swing. New York. J.P. Lippincott Co.
Colman S., Anderson D. (2007) An examination of the planar nature of golf club motion in the swings of experienced players. Journal of Sports Sciences 25, 739-748.
Coleman S., Rankin A. (2005) A three-dimensional examination of the planar nature of the golf swing. Journal of Sports Sciences 25, 227-234.
Dean R. K., Nesbit S. M. (1988) Evaluation of finite difference schemes for the solution of the inverse velocity and acceleration problem for robot manipulators. Proceedings of the Third International Conference on CAD/CAM, Robotics, and Factories of the Future , 210-216.
Dillman C. J., Lange G. W. (1994) How has biomechanics contributed to the understanding of the golf swing?. Proceedings of the 1994 World Scientific Congress of Golf, St. Andrews, Scotland , 3-13.
Farrally M.R., Cochran A.J., Crews D.J., Hurdzan M.J., Price R.J., Snow J.T., Thomas P. R. (2003) Golf science research at the beginning of the twenty-first century. Journal of Sports Sciences 21, 753-765.
Hume P.A., Keogh J., Reid D. (2005) The role of biomechanics in maximizing distance and accuracy of golf shots. Journal of Sports Medicine 35, 429-449.
Jorgensen T. (1970) On the dynamics of the swing of a golf club. Am. J. Physics 38, 644-651.
Jorgensen T. (1994) The physics of the golf swing. API Press, New York.
Kane T.R., Likins P.W., Levinson D. A. (1983) Spacecraft dynamics. New York. McGraw-Hill Co.
Lampsa M. A. (1975) Maximizing distance of the golf drive: an optimal control study. Journal of Dynamic Systems, Measurements, and Controls: Transactions of the ASME 97 (Series G)Dec , 362-367.
Milne R.D., Davis J. P. (1992) The role of the shaft in the golf swing. Journal of Biomechanics 25, 975-983.
Miura K. (2001) Parametric acceleration - the effect of inward pull of the golf club at impact stage. Sports Engineering 4, 75-86.
Neal R.J., Wilson B. D. (1985) 3D kinematics and kinetics of the golf swing. International Journal of Sport Biomechanics 1, 221-232.
Nesbit S. M. (2005) A Three-dimensional kinematic and kinetic study of the golf swing. Journal of Sports Sciences and Medicine 4, 499-519.
Nesbit S.M., Serrano M. (2005) Work and power analysis of the golf swing. Journal of Sports Sciences and Medicine 4, 520-533.
Thomas W.F. (1994) The state of the game, equipment and science.
Vaughan C. L. (1981) A three-dimensional analysis of the forces and torques applied by a golfer during the downswing. Biomechanics VII-B, University Park Press, Baltimore, MD. 325-331.
Williams D. (1966) The dynamics of the golf swing. Quarterly Journal of Mechanics and Applied Mathematics 20, 247-255.


Back
|
PDF
|
Share