|
|
|
JOURNAL
OF
SPORTS SCIENCE &
MEDICINE
|
 |
|
Receive
a notification that a new issue of JSSM is online Sign
up
© Journal of Sports Science and Medicine (2007) Suppl. 10 , 175 - 180
33. STRENGTH AND SPEED P-098 Effects of strength training and practice on soccer throw-in performance Greg De
Carnys and Adrian Lees
OBJECTIVE The long throw-in when performed to a high standard, can reach a maximum horizontal range (MHR) of around 30m and is largely a more accurate skill than the corner kick. This means that a teammate can be picked out for a goal scoring opportunity more easily when within range. The improvement of soccer throw-in performance is there-fore an important issue but has been neglected in the scientific literature. The aim of this paper was to examine the ef-fects of two performance enhancing programs on throw-in performance. METHODS A total of 13 male and 10 female university soccer players were allocated to one of three groups (control group N = 7, strength group, N= 9 and practice group, N= 7) and instructed to perform 5 throw-ins while standing and 5 throw-ins with a run-up. All trials were video filmed at 50 Hz and the horizontal range recorded. RESULTS For the running throw-in both strength training (17.05m-18.27m, F1,14 = 6.21, p < 0.05) and practice (16.40m-17.81m, F1,12 = 7.29, p < 0.05) were found to significantly increase performance over 6 weeks while the control group did not (17.93m-18.03m, NS). For the standing throw-in, there was no significant change (practice group:-14.31m-15.24m; strength group:-14.83m-14.43m; control group:-15.33m CONCLUSION In conclusion, the present study showed that both strength training and practice can improve soccer throw-in performance in male and female soccer players with strength training providing the largest increase. For future studies a combination of these two types of training would be worth investigating KEY WORDS
Strength training, soccer, throw-in, biomechanics P-099 Power output during repeated maximal sprints is better maintained after maximal strength training compared to hypertrophy training in soccer players Aggeliki
Papaspyrou1, Gregory, C. Bogdanis1, Athanasios Souglis2, Apostolos
Theos1, Aristo-menis Sotiropoulos2 and Maria Maridaki1 OBJECTIVE The ability to perform in repeated maximal bouts with short recovery is of extreme importance in soccer. Since power depends on the ability to produce force at fast speeds, strength training is frequently used to improve short sprint performance (Hoff & Helgerud, 2004). The influence of resistance training type on fatigue during repeated sprint-ing bouts with short recovery has not been tested. The purpose of the present study, which had Ethical Committee ap-proval, was to examine the effects of two different strength training programs (3 times/wk, 6 weeks) on power output during repeated sprints on cycle ergometer. METHODS
Twenty male players (age: 22.3±1.1 yrs, mass: 74.6±2.0 Kg) were divided
in two equal groups that fol-lowed two different programs. One program
was designed to promote muscle hypertrophy (H, 4 sets x 12 reps, with
70% 1RM) and the other aimed to increase maximal strength (S, 4 sets x
5 reps, with 90% 1RM). Optimal braking force (Fopt) was determined for
each player with a test consisting of 5 6s maximal sprints on a Monark
cycle ergometer against different loads (Arsac et al, 1996). Ten 6s sprints
separated by 24s of recovery were performed before and after training,
with a load equal to 60% Fopt. DISCUSSION Hypertrophy training may increase local aerobic capacity and performance recovery (Tesch, 1992). However, this was not seen in the H group. The better maintenance of power output in the S group may be explained by more efficient muscle fiber recruitment during the later stages of the sprint test as a result of neural adaptations after maximal strength training (Almasbakk and Hoff, 1996). Table
1. Peak (PPO) and mean power output (MPO) during the 1st and 10th
sprint and drop in MPO from the 1st to the 10th sprint before (Bt) and
after training (At). LLV: lean leg volume. : different from "before
training", P<0.05. REFERENCES KEY WORDS
Repeated sprints, fatigue, strength training P-100 Developing effect by eccentric - concentric contraction in two directions on speed components of soccer and basketball players Mohamed
Keshk and Ahmed Eltantawy OBJECTIVE Different forms of take off are considered to be the direct way of plyometric work that the prime mover muscles for legs under coiling muscle flows strong explosive contraction that it reverses good coordination of muscles to overcome the body weight. To increase the muscular effectiveness, There were a shortage in plyometric exercises which compatible with dynamic performance path and generation the power in this two directions we need in soccer and basketball, in addition, formation suitable training load doses for this two direction (horizontal - vertical). The research investigated the development effect for the groups of legs muscles through eccentric - concentric contraction in the vertical and horizontal directions on level of speed components. The difference between the two directions of training was recognized on research variables (speed components). METHODS The sample consisted of 26 active soccer and basketball players (14 soccer & 12 basketball) of Mansura university teams .The researchers had the experimental method with pre-post measures for 5 tests (10 , 30 meters sprint - vertecal jump - 5 series of take off test - 120 yards to mearuser release speed , maximum speed and speed endurance) was used.The training program continued for 8 weeks with four exercises that was chosen with height intensity to be done in the vertical and horizontal directions RESULTS
The main results was that the two groups level of speed components improved
in 10 , 30 meters sprint (V group 10 meters pre test 2.232 ±0.080 post
test 2.150 ±0.075 & 30 meters pre test 4.539 ±0.107 post test 4.449
±0.072 ) (H group 10 meters pre test 2.234 ±0.073 post test 2.179 ±0.071
& 30 meters pre test 4.531 ±0.108 post test 4.419 ±0.008 ), 5 series
of take off test (V group distance pre test 11.471 ±0.391 post test 12.407
±0.895 & time pre test 4.383 ±0.913 post test 3.631 ±0.261 ) (H group
distance pre test 11.486 ±0.381 post test 13.611 ±1.098 & time pre
test 4.458 ±0.919 post test 3.590 ±0.137 ) - release speed (V group pre
test 5.803 ±0.395 post test 5.429 ±0.281) (H group pre test 5.853 ±0.405
post test 5.471 ±0.238) - maximum speed (V group pre test 4.631 ±0.115
post test 4.451 ±0.103) (H group pre test 4.650 ±0.115 post test 4.426
±0.114) -vertical jump (V group pre test 43.143 ±4.511 post test 48.750
±2.158) (H group pre test 43.446 ±4.541 post test 46.064 ±2.420), but
not improved in speed endurance DISCUSSION There was a significant difference between two groups of improvement levels as a result of direction difference in exercises. The cause of non significant improvement may due to the shortage of program time. Using plyometric exercises with different intensities for long time would relatively affect the speed components. We can use this program for other activities by must know the main direction of movement .sing the tests of the research on other activates and other ages KEY WORDS
Plyometric, 5 series takeoff test, release speed, maximum speed, vertical
jump. P-101 Change of explosive muscle strength in sub-20 soccer players in a season Jefferson
Eduardo Hespanhol2, Miguel De Arruda1, Leonardo Gonçalves Silva Neto1 and Joel Moreira Prates
OBJECTIVE High speed actions during soccer competition can be categorized with actions requiring acceleration, maximal speed or agility (Lıttle and Wıllıamas, 2005). Starting with these characteristics, it is possible to see that mus-cle force associations with high speed actions are fundamental for the performance of soccer players (Stolen, 2005). The aim of this study was to describe the changes in explosive strength performance of soccer players of the sub-20 age group during a season. METHODS 28 Brazilian soccer players (18,18±0,41years, 75,09±6,31kg, 178,33±5,75cm), competed in the 2005 sea-son, participated in this study. The data were collected before and after pre-season, in season, season during of 16 weeks.The performances of these variables were measured by tests of squat jump (SJ), countermovement (CMJ) and the continuous jump the 5 seconds (CJ5s) done according to the procedures described by Bosco (1994). RESULTS Significant increase in the performance of the variables of SJ (5,56±1,85%; p=0,0167) and CMJ (5,65±2,88%; p=0,0004) after the pre-season, however significant changes was not observed in the performance of the CJ5s (-0,18±1,40%; p=0,9268). In Season was possible to see increases in the performance of CJ5s (4,63±2,39%; p=0,0034) , and no changes were observed for the SJ and CMJ (-0,54±3,98%; p=0,7705, -0,60±2,96%; p=0,7587, re-spectively). Significant changes were observed after the season for all variables, showing increases in the performance of SJ, CMJ and CJ5s (4,66±5,57; p=0,0461, 5,40±3,17; p=0,0081, 4,41±3,35; p=0,0482, respectively). DISCUSSION According to these results in soccer players, there is a tendency for the occurrence of increases in all muscle explosive strength manifestation after the season, thus, during the period of training different behaviour in the performance of strength were observed. This seemed to be due to adjustments in the factors of strength production that expressed behaviour under different ways in season. REFERENCES KEY WORDS
Soccer, strength training, periodization. P-102 Change in physical performance of sub-20 soccer players submitted in maximal strength training program Miguel
Arruda1, Jefferson Eduardo Hespanhol2, Leonardo Gonçalves Silva Neto1 and Joel Moreira Prates1 OBJECTIVE The maximal strength of the muscle should be understood as a manifested strength that influences all other components and for this reason is located in an upper hierarchical level (Schmıdtbleıcher, 1992) The strength training possibility changes of the able factors of force production that increases in the agility and speed performance of the soccer players. The aim of the study was to verify the changes in the physical performance of sub-20 soccer players submitted in a six week training program of a maximal strength over the changing of agility and explosive strength performance. METHODS Participants were twenty-two Brazilian soccer players, all competed in the 2006 season in the Paulista Juniors Championships, Brazil. The measurements were before and after pre season of 6 weeks of the training program of maximum strength. The physical exercises were based in the methods to improve rate force development (Schmıdtbleıcher, 1992). These tests were squat jump (SJ), countermovement (CMJ) (Bosco, 1994) Illinois Agility (Mıller et al 2006) and maximum strength. RESULTS The results showed increases in the performance of the Fmax after the training programme (33,59±10,08%; p=0,0000). Observing other variables there were significant increases after the training program in the performance of the variables of explosive strength (8,56±4,14%; p= 0,0283) and agility (2,88±1,65%; p= 0,0011). However, there was no significant change for elastic explosive strength, even indicating increases in its performance (7,53±6,80%; p= 0,0894). Table
1. Changes in physical performance. REFERENCES KEY WORDS
Soccer, strength training, periodization. P-103 Biomechanical symmetry differences in the goalkeeping diving save Wayne
Spratford1, Brendan Burkett2 and Rebecca Melifont2 OBJECTIVE This study focuses on the biomechanical aspects of elite football goalkeepers' making diving saves at different heights and to different sides of their body in order to identify potential weaknesses in goalkeeping perform-ance. The object of this study was to identify and quantify the kinematic and kinetic parameters for a goalkeeper's div-ing saves. Due to a paucity of research particular attention was paid to symmetry differences made between dominant (preferred kicking leg) and non-dominant sides of the body (non preferred kicking leg) (Lees, 1996; Tsai, 2005). METHODS Six national squad members performed six diving saves to stationary suspended balls at three different heights to both their dominant and non-dominant sides while watching a projected video image of ball being kicked. Synchronised three-dimensional biomechanical data was captured using a Vicon Motion Analysis System (kinematic) and a Kistler Instrumented Force Platform (kinetic). RESULTS The kinetic profile was similar from dominant to non-dominant sides. Kinematic differences were observed to the non-dominant side with a higher COM (centre of mass (p=0.03)), greater hip flexion (p=0.01), higher amount of pelvis rotation (p=0.02), higher amount of thorax rotation (p=0.003) evident. Results also indicated that the COM pro-jected in a less direct line towards the ball during saves made to the non-dominant side at all heights (p=0.001). Table
1. Peak force (bw), COM height (cm), hip angle, pelvis angle and thorax
angle (degrees). REFERENCES KEY WORDS
Diving save, goalkeeper, kinematics, kinetics, dominant. P-104 Aerodynamic factors in soccer: A comprehensive review Mehmet
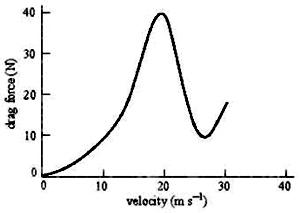
Uygur1, Hayri Ertan2, Settar Kocak2 and Feza Korkusuz2 OBJECTIVE Many football fans will remember the free kick taken by the Brazilian Roberto Carlos in a tournament match against France in 1997. The ball curved to the left and entered the top right-hand corner of the goal to the amazement of players, the goalkeeper and the media alike. But for the physicist, the motion aerodynamics of football has to be discussed in order to understand this movement of the ball. The purpose of this study was to discuss Reynolds number, drag coefficient, boundary layer and magnus effect in order to understand the motion aerodynamics of football. METHODS Carlos kicked the ball with the outside of his left foot to make it spin anticlockwise as he looked down onto it. Conditions were dry, so the amount of spin he gave the ball was high, perhaps over 10 revolutions per second. RESULTS Kicking hard with the outside of foot allowed the ball to reach a velocity of 108 km/h. This speed was over the critical velocity (Figure 1). The flow of air over the surface of the ball was turbulent with the separation points at the back, which gave the ball a relatively low amount of drag that was a function of velocity as much as depended on the shape of the object. CONCLUSION
Some way into its path around the 10 m mark the ball's velocity dropped
such that it entered the lami-nar flow regime. This substantially increased
the drag on the ball, which made it slow down even more. This enabled
the sideways Magnus force, which bent the ball towards the goal, to come
even more into effect. KEY WORDS
Aerodynamic Factors, Soccer.
|
|