|
|
|
| |
| ABSTRACT |
|
The aim of this study was 1) to define a new index to describe running coordination, named % of coordination, and 2) to examine whether it could represent an order parameter in relation to running velocity. Twelve international middle-distance athletes (six males and six females) performed three trials at easy, 5000 m pace and sprint velocities while filmed from a lateral view at 240 Hz. Notational analysis of six lower-limb key events corresponding to touchdown, mid-stance and flight phases was performed with high values of intra- (maximum standard deviation = 7 ms) and inter-operator (maximum systematic bias = 6 ms) reliability. Running velocity manipulations resulted in substantial and progressive increases in stride length, stride frequency (all p’s < 0.001) and % of coordination (p < 0.001; η²p = 0.77), while duty factor showed a progressive reduction (p < 0.001, R2c = 0.86). However, % of coordination depended on the stride phase (p < 0.001; η²p = 0.78), with greater time gaps between key events in touchdown and mid-stance than in the flight phase. Results confirmed that % of coordination can illustrate changes in movement organisation, representing an easy tool for evaluating the running technique of competitive athletes. |
| Key words:
Biomechanics, motor control, dynamical systems, performance, running
|
Key
Points
- A new running coordination index to evaluate the patterns of running coordination was obtained from notational analysis of the running cycle.
- % of coordination in the touchdown, mid-stance and flight phases increased according to increases in the running velocity.
- A lower % of coordination was detected at touchdown and mid-stance compared to the flight phase.
|
Running skills are an important technical aspect related to the performance in several sport disciplines, both individual and team sports. From a deterministic perspective (Chow and Knudson, 2011), running velocity, as a cyclic movement, depends on the stride length (distance covered in a running cycle) and stride frequency (number of running cycles per time unit). However, for analysis purposes, each step is usually divided into the stance and flight phases, being ground reaction forces produced on the breaking and pushing parts of the stance (van Oeveren et al., 2021). Different running styles have been described in the literature based on the occurrence of key events in the athletes’ movements and, for example, front- and back-side mechanics (Haugen et al., 2018; Piasenta, 1994) or the ‘Stick’, ‘Bounce’, ‘Push’, ‘Hop’ and ‘Sit’ (van Oeveren et al., 2021) styles have been defined. In addition, researchers have typically characterised kinematic data from isolated joints and segments during the stride phase or at specific instants like touchdown or take-off (Miyashiro et al., 2019). For example, during the stance phase, researchers have measured the knee joint angle and the thigh lift inclination of the support and swing legs, the distance between the knees at touchdown and the foot, shank and thigh inclinations at take-off (Yada et al., 2011). The influence of velocity on these running parameters has been widely described in the literature and it supports the notion of velocity acting as a control parameter that causes changes in the running characteristics (Patoz et al., 2022). Accordingly, the discrete kinematic measures and the relative duration of step phases seem to be modified when increasing running velocity, with greater joint range of movement and torque especially above 7 m/s (Dorn et al., 2012; Schache et al., 2015). From a Dynamic Systems Theory perspective, the lower limbs during running have been acknowledged to be acting as a system and not as individual joints or segments acting independently (Hamill et al., 1999). Consequently, the relationships between segments has been suggested as an important line of investigation and the inter-limb patterns of coordination (coupling relationships) have been measured to fully comprehend running mechanics (Kakehata et al., 2021). Also, changes in the pattern of movements responding to the different aspects (constraints) of practice have been quantified as coordinative variability (Bernstein, 1967). However, results from a dynamic approach have been mainly focused on injured runners (Foch and Milner, 2019; Hamill et al., 1999). In healthy runners, patterns of running coordination have been reported to be moderately influenced by small changes of running velocity (Floria et al., 2019) or the runners’ experience (Floria et al., 2018). In particular, Bushnell and Hunter (2007) observed that the timing of the swing leg movement relative to touchdown with the contralateral limb is important for achieving a higher stride frequency. However, very little evidence has been provided on the running coordination of competitive athletes and how they adapt their movements to the different task constraints. In other cyclic sport disciplines like swimming, the identification of critical events during movement patterns or notational analysis (Hughes and Franks, 2004) has been applied to quantify the individuals’ inter-limb timing during the swimming techniques under different constraints (Chollet and Seifert, 2011). Considering the lack of simple tools for the analysis of the patterns of coordination during running and the importance of this skill for many sport disciplines, the aim of the present research was 1) to define a new index to describe running coordination, named the % of coordination, and 2) to examine whether the % of coordination could represent an order parameter in relation to running velocity. It was hypothesised that the % of coordination, measured as normalised time gaps between the key events of moving body parts, would increase at high velocities, according to the technical model of Piasenta (1994). ParticipantsTwelve international and national level middle-distance athletes agreed to participate in the study. The participants were six males (age: 33.3 ± 13.5 years, height: 1.77 ± 0.07 m, mass: 66.3 ± 10.3 kg, personal best 5000 m time: 15:12 ± 1:13 min, ranging from 13:50 to 17:00 min) and six females (age: 22.5 ± 4.7 years, height: 1.69 ± 0.07 m, mass: 54.3 ± 4.5 kg, personal best 5000 m time: 17:22 ± 0:52 min, ranging from 15:42 to 18:00 min), with half of them having been selected to compete with their national team in the European Athletics Championships. All the participants had been training regularly for at least 6 years, averaging six running (≈ 80 km/week) and two to three strength training sessions per week. All subjects gave written informed consent before testing, and all protocols and procedures used in testing were approved by the Local University Ethics Committee.
Experimental protocolAfter a 30 min warm-up selected by their coach, participants performed three trials at different running velocities, ranging from easy pace to 5000 m personal best pace and to sprint. These velocities represent the moderate (below lactate threshold), severe (above critical velocity) and extreme (above VO2max) intensity domains as described elsewhere (Jones et al., 2019). Specifically, two 800 m trials were performed on an official 400 m track at easy and 5000 m pace, respectively, and two 80 m sprints were performed on the track straight to simulate the last part of the race. The participants were instructed to maintain a constant speed during the 800 m trials (easy and 5000 m), and to achieve their maximal speed from 40 m onwards in the 80 m sprints. All the trials were started from a two-point standing position and no spikes were worn. The rest period was 5 min between trials (Figure 1). Two still cameras (EXILIM ZR5000, Casio Computer Co., Japan) filming at 240 Hz were located on the straights of both tracks to record the section from 40 to 50 m. The cameras were placed perpendicular to the direction of the athletes, at approximately 5 m from the lane centre, and captured a running section of about 6 m with a lateral view of athletes. Before trials, a rectangular calibration frame of 1 m height and 5 m length containing four control points was located in the centre of the athletes’ lane. The calibration frame was filmed and removed before recording the trials.
Data processingAn expert operator with more than 30 hours of specific experience (Seifert et al., 2006) performed the notational analysis of the collected videos. Firstly, manual digitalisation was performed with Kinovea 0.9.5 software (Joan Charmant & Contrib., kinovea.org) to identify the athletes’ hip centre at the beginning (touchdown) and end (take-off) of the running cycle. Screen coordinates were then transformed into two-dimensional real space coordinates by means of Direct Linear Transformation algorithms (Abdel-Aziz and Karara, 1971). Secondly, six different instants of the running step were visually identified and time-coded (from a lateral view of athletes) according to ALTIS Kinogram (McMillan and Pfaff, 2018) and to Piasenta’s running technique models (Piasenta, 1994): i) foot touchdown, ii) recovery knee aligned with the support knee in the running direction, iii) centre of the hip vertically aligned with the support ankle, iv) recovery heel aligned to the support knee in the running direction, v) shank horizontal to the ground during the early swing phase of the rear leg and vi) maximum knee extension during the late swing phase of the driving leg. Instructions were provided to the expert operator to identify the key events based on the athlete’s joint centres. From the hip positions of the athletes, the stride length (m), defined as the horizontal distance from the hip’s athletes at the beginning and end of the running cycle, the stride frequency (Hz), defined as the inverse of the time employed in the running cycle, and the stride velocity (m/s), defined as the product of stride length and frequency, were calculated for each trial. In addition, the contact and flight times for each stride (s), and the pushing and braking times during the stance phase were computed. The duty factor (DF) was also calculated as tcontact/2·(tcontact + tflight), and it was expressed as a percentage (van Oeveren et al., 2021). On the other hand, from the six key instants of the stride cycle, discrete relative phase measurements (Wheat and Glazier, 2006) were employed to quantify the inter-limb coordinative patterns while running and were expressed as a percentage:
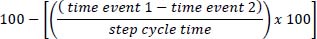 Each normalised time gap (named the % of coordination) was referred to a sub-phase within the running cycle and comprised the following key events, illustrated in Figure 2:
- Touchdown: the lag time between the touchdown of the foot (event
1) and the instant both the recovery and the support knees are aligned in
the running direction (event 2). Following Piasenta’s model (Piasenta,
1994), both knees should be aligned
before or at touchdown.
- Mid-stance: the lag time between the instant the hip is on top
of the support ankle (event 1) and the instant the recovery heel is aligned
with the support knee in the running direction (event 2). Following Piasenta’s
model (Piasenta, 1994), the hip should
be on top of the support ankle before or at the same time as the recovery
heel and support knee are aligned.
- Flight: the lag time between the instant the shank is parallel
to the ground during the early swing of the recovery leg (event 1) and the
instant the knee of the driving leg is at maximum extension during the late
swing (event 2). Following Piasenta’s model (Piasenta, 1994),
the shank should be parallel to the ground before or at maximum extension
of the driving knee.
The notational analysis of videos was tested for intra- and inter-operator reliability. The same trial was codified by the expert operator (operator 1) ten times on different days (one per day), with a blind analysis where no information about the time coding was provided during each visualisation. Then, analysis was compared with that of an independent operator (operator 2). On the other hand, the reconstruction error in the two-dimensional spatial coordinates of runners was checked for accuracy. This was done by calculating the distance between two control points in the calibration frame not employed for calibration purposes. The RMS error for both the horizontal and vertical axes was lower than 0.01 m.
Statistical analysisWe performed a Bland-Altman analysis to check inter- and intra-observer reliability. Then, we conducted a Linear Mixed Model including random slopes and random intercepts. Trials (n = 120) were nested into the random factor participant (n = 12) whereas running velocity acted as a fixed factor. Sex (male and female) was also included as a fixed factor whenever it improved the model fit. We presented R2m and R2c, ICC of random components, BIC and omnibus ANOVA. We also performed a three-running velocity (easy, 5000 m and sprint) by three % of coordination (touchdown, mid-stance and flight) Repeated Measures ANOVA, considering as observations the average of participants’ trials within running velocity conditions. The normality of residuals was confirmed with K-S tests and visual inspection of Q-Q plots. Post hoc comparisons were computed with Bonferroni correction. All analysis considered a = 0.05. IBM SPSS V. 25 and R-Based jamovi (www.jamovi.org) V. 2.3. were employed for statistical analysis and figure production.
Inter- and intra-operator reliabilityThe intra- and inter-operator reliability when detecting six key events in the running cycle is indicated in Table 1. The standard deviation of the repeated analysis by the same observer was 0 ms in half of the key events, whereas the maximum standard deviation of 7 ms was observed in event 6. The 95% limits of agreement between operators displayed a maximum systematic bias of 3 ms in event 6, whereas the random error ranged from 4 ms (event 5) to 21 ms (event 6). A graphical representation of the differences obtained in each observation is shown in Figure 3.
Manipulation of running parametersStride length, R2m = 0.82, R2c = 0.95, ICC = 0.71, BIC = -73.05, increased by 15.9% and by 21.49% in each of the running velocity conditions (F2,19.49 = 824.95, p < 0.001), with post hoc differences among all pairwise comparisons (p’s < 0.001). The omnibus test revealed longer length in males than females (F1,12 = 5.88, p = 0.032). Frequency, R2m = 0.76, R2c = 0.97, ICC = 0.88, BIC = -403.97, increased by 4.9% and by 19.2%, respectively (F2,19.19 = 208.84, p < 0.001), with post hoc differences among all pairwise comparisons (p’s < 0.001) but no effect of sex factor. Running velocity, R2m = 0.93, R2c = 0.98, ICC = 0.66, BIC = 49.55, increased by 22.2% and 44.4% (F2,13.95 = 1243.67, p < 0.001), representing a 5000 m running pace of 3:02 min/km for males and 3:34 for females. Pairwise comparisons among all three running velocity conditions were significant with p’s < 0.001 and, in addition, differences for sex (F1,12 = 9.60, p = 0.009) were found.
Stride cycle phasesAthletes modified the time employed in each of the stride cycle phases when increasing running velocity (Table 2). DF decreased from 31.34 to 25.64, from easy to sprint velocity (F2,12 = 29.63, p < 0.001, ICC = 0.62, R2m = 0.49, R2c = 0.86, BIC = 651.79), and post hoc tests indicated differences among all running velocity conditions (p’s < 0.001). Yet, the brake and push phases within the contact time maintained similar ratios across running velocity conditions (F2,35.15 = 0.32, p = 0.727, ICC = 0.29, R2m = 0.00, R2c = 0.31, BIC = 694.70). For this group of variables (% of stride cycle), the sex factor did not reveal any main effect or interaction, nor significantly improved linear model fit so it was not included in the model.
Running coordinationRM ANOVA revealed differences among the three % of coordination (F1.52,16.71 = 38.11, p < 0.001, η²p = 0.78), with flight coordination presenting higher values (lower time gaps) than both touchdown and mid-stance phases (post hoc p’s < 0.001). All indices showed upward trends, as confirmed by the main effect of running velocity (F1.19,13.10 = 37.71, p < 0.001, η²p = 0.77), but an interaction effect (F2.39,14.80 = 4.60, p = 0.015, η²p = 0.29) indicated that flight values increased more steeply from easy to 5000 m compared to mid-stance (F1,11 = 6.97, p = 0.023, η²p = 0.39) and close to significance compared to touchdown (p = 0.052). Touchdown coordination values ranged from 87.6% at easy pace to 91.7% when sprinting, with differences among all three running velocities (p’s < 0.01), showing a decrease in the time gap with increasing running velocity (F2,12 = 25.72, p < 0.001, ICC = 0.79, R2m = 0.31, R2c = 0.86, BIC = 461.61). Mid-stance coordination varied from 89.3% to 91.1% as running velocity increased (F2,19.49 = 9.25, p = 0.001, ICC = 0.25, R2m = 0.12, R2c = 0.36, BIC = 507.94), with sprint values being higher (smaller time gap) than those for both 5000 m pace (p = 0.013) and easy pace (p = 0.004). For the flight phase, the index of coordination ranged from 93.6% to 95.2%, although time gaps decreased with increasing velocity (F2,13.28 = 7.66, p = 0.006, ICC = 0.52, R2m = 0.21, R2c = 0.74, BIC = 577.53) (Figure 4). Post hoc tests revealed that the time gap was greater (lower values) at easy pace compared to 5000 m (p = 0.015) and sprint (p = 0.008). The sex factor was not included in the models as no differences in the coordination indices were observed between male and female athletes.
The aim of the present research was to propose a new index to describe running coordination and to examine how changes in running velocity would affect this new index. The results confirmed that, when calculated by notational analysis, the % of coordination can illustrate changes in movement organisation, as coordinative patterns tended to be in-phase when athletes approached at high range velocities. The notational analysis of the running coordination showed high levels of intra- and inter-operator reliability, even if the frame rates employed were greater than recommended for running analysis (Payton and Bartlett, 2008). This had been previously observed in expert operators who coded the key events of swimming videos subjectively and obtained high accuracy in comparison to manual digitising of data (Seifert et al., 2006). When the same operator repeatedly identified the key events during the running cycle (except one event), the standard deviation values were lower than the duration of one video frame filmed at 240 Hz (4 ms). This also occurred with the systematic differences between the analyses of independent operators: lower than 4 ms for all key events. Therefore, the uncertainty assumed for the identification of the key events during the running cycle was much less than the time gaps that determine different patterns of coordination (±8% of the stride cycle duration). Greater differences were observed in one specific event (maximum knee extension of the driving leg during the late swing phase), with a standard deviation of 7 ms within and 3 ms between operators. This would suggest that specific training should be performed by operators coding this event and that a reliability test should be conducted to confirm the analysis (Knudson, 1999). Athletes increased relatively more the stride length (15.9%) than the stride frequency (4.9%), as previously suggested (Schache et al., 2014), when augmenting velocity from an easy (4:00 min/km) to a 5000 m pace (3:17 min/km). On the other hand, at the highest velocity, the stride frequency augmented considerably more (19.2%) to assist in the velocity transition to sprinting (Hunter et al., 2004). Running velocities at severe and extreme intensities were similar to those previously reported in national/international level athletes (Bushnell and Hunter, 2007), with athletes surpassing 7 m/s at sprint which has been described as a threshold velocity where torques on the lower limbs increase dramatically (Dorn et al., 2012; Schache et al., 2015). Changes in the running velocity were accompanied by modifications in the DF. As previously reported (Patoz et al., 2022), contact times decreased with increasing velocity until attaining a similar proportion to the flight times, indicating that the work contribution by the contractile muscle was progressively substituted by elastic storage and return by tendons. DF values ranged from 31.3% to 25.6%, which could be categorised as a DFhigh group (Lussiana et al., 2019). Within the stance phase, the brake and push times were reduced with increasing velocity, as previously reported (Lussiana et al., 2019; Patoz et al., 2020), but the proportion of the breaking to pushing phases was approximately one- and two-thirds, respectively. This distribution did not change across the moderate, severe and extreme intensities, showing relatively symmetrical patterns of ground force application across all speeds, which is in contrast with previous results (Cavagna, 2006). Nevertheless, this could be explained by the high DF values of elite athletes in the present study who would minimise vertical displacement of their centre of mass and would favour forward displacement by maintaining greater push to brake times (Lussiana et al., 2019; Patoz et al., 2020). Patterns of coordination seemed to be dependent on the running velocity an also on the stride phase (Figure 4), as athletes tended to decrease time gaps between the observed key events when increasing running velocity from easy pace to sprinting. At touchdown, time gaps between foot contact and the instant the knees were aligned in the running direction represented an average of 8.3% of the running cycle time when sprinting. Considering the stride cycle times of athletes in the present study lasted ≈ 550 ms, time gaps would represent about 45 ms (approximately ten frames of video at 240 Hz) between events. This was similar to what was observed at mid-stance, where time gaps of around 8.9% of the stride cycle time were detected between the hip being on top of the support ankle and the recovery heel being aligned with the support knee. In both cases, shorter time gaps would be expected to occur when sprinting, with the aim of decreasing the breaking forces of the stance and to achieve more horizontal ground reaction force (Kivi et al., 2002), as this would assist in achieving faster velocities (Kakehata et al., 2021). However, the middle-distance runners in the present study may not be familiarised with the required technical modifications related to the change in touchdown geometry (Bushnell and Hunter, 2007) which would include decreasing the knee extension at take-off (Mann and Herman, 1985), increasing the hip angular velocity (Kivi et al., 2002) and the knee flexion at recovery (Williams and Cavanagh, 1987) or modifying the type of foot-strike (Bushnell and Hunter, 2007). Previous research has detected differences between sprinters and distance runners in all these kinematic parameters (Bushnell and Hunter, 2007; Kakehata et al., 2021). For the flight phase coordination, lower time gaps of 1.9% (≈ 10.5 ms or 2–3 frames at 240 Hz) of the difference between the shank being horizontal in the early swing and the maximum knee extension of driving leg were detected. The longer flight-to-contact times may give the athletes enough time to control the position of their moving limbs before touchdown (van Oeveren et al., 2021). Changes in the pattern of coordination with velocity also depended on the stride phase. In the touchdown and mid-stance phases, changes in the % of coordination were lower when transiting at 5000 m velocity than at sprinting. As confirmed by the stride length data, athletes relied on lengthening their stride when increasing the velocity (Table 2). This has been related to very little changes in the overall running form, although some adjustments may occur in the body positioning (Bushnell and Hunter, 2007). However, when sprinting, the observed reduction of the coupling time gaps was probably a consequence of athletes trying to substantially increase the stride frequency (Dorn et al., 2012; Schache et al., 2014), with all the aforementioned technical modifications involved. Conversely, changes in the % of coordination during the flight phase were lower when sprinting. This could be explained by the longer flight times of the 5000 m pace compared to the easy velocity, which would allow athletes to have more time to adjust the inter-limb movements during the flight (van Oeveren et al., 2021). Previous studies have reported that the flight phase remains relatively unaffected by modifications in the task constraints compared to the stance phase (De Wit et al., 2000), which could explain why the main coordinative modifications for sprinting would occur at the stance couplings. Interestingly, no gender differences were observed in the % stride phases nor the patterns of coordination of middle-distance athletes. As expected, male athletes present longer stride lengths and running velocities than females for a certain intensity domain. This has been explained by male athletes being generally taller than females and presenting greater hip flexion during stance, but also by males exerting a greater peak force and peak power than females (Williams et al., 1987). However, these gender differences, as well as others such as the range of motion in the frontal plane and the internal-external rotation of the lower limbs (Takabayashi et al., 2017), did not represent specific patterns of coordination by gender. This could be supported by the lack of gender differences in the % flight-to-contact ratio, contrary to what was previously observed when comparing absolute velocities, where females demonstrated a faster time to peak force and a lower proportion of the stride time in contact with the ground (Barnes et al., 2014). The fact that the female athletes in the present study were part of an elite training group and probably presented a high level of lower-limb strength and/or neuromuscular control could explain similar coordination patterns observed as for male athletes. Also, the fact that gender comparisons were made at similar relative domain intensities and not with absolute velocities would reject the notion of female athletes presenting greater stride frequencies and being less economical than males (Barnes et al., 2014). The present findings confirmed the utility of the proposed notational analysis as a simple and reliable tool to evaluate running coordination in different velocities. The normalised time gaps between key events in the touchdown, mid-stance and flight phases seemed to provide a deep understanding of how athletes self-organise according to the running constraints. Patterns of coordination in competitive middle-distance runners did not completely adhere to Piasenta’s model (Piasenta, 1994), although the increase in the running velocity was related to smaller time gaps between selected events in the running cycle. All evaluation procedures were obtained from a temporal analysis, where no calibration procedures for spatial coordinates’ reconstruction were required. This would ease the application of the coordinative parameters by coaches and practitioners in their training routines to increase the understanding of the athletes’ movements. Further research where the inter-segment couplings could be compared under different constraints (task, organismic or environmental) while running could increase the understanding of how athletes organise their movements. A new tool to evaluate the patterns of running coordination in competitive athletes was proposed and a high level of intra- and inter-operator reliability was obtained from notational analysis of the running cycle. Inter-segment time gaps in the touchdown, mid-stance and flight phases (defined as % of coordination) decreased according to increases in the running velocity and responded to the required changes in stride length and frequency, revealing order parameters that can explain relationships between moving parts of the body in running. Adherence of middle-distance runners to the running model depended on the running velocity but also on the stride phase as a lower % of coordination was detected at touchdown and mid-stance compared to the flight phase.
| ACKNOWLEDGEMENTS |
There is no conflict of interest. The present study complies with the current laws of the country in which it was performed. The datasets generated and analyzed during the current study are not publicly available but are available from the corresponding author, who was an organizer of the study. |
|
| AUTHOR BIOGRAPHY |
|
 |
Jesús Martínez-Sobrino |
| Employment: Departamento de Deportes, Universidad Politécnica de Madrid, Madrid, Spain |
| Degree: PhD Student |
| Research interests: Triathlon, dynamical systems, competition analysis |
| E-mail: j.msobrino@upm.es |
| |
|
José Antonio Navia |
| Employment: Facultad de Educación, Universidad de Alcalá, Madrid, Spain |
| Degree: PhD |
| Research interests: Motor control, expertise, performance analysis |
| E-mail: jose.navia@uah.es |
| |
|
Juan Del Campo-Vecino |
| Employment: Universidad Autónoma de Madrid. Facultad de formación de Profesorado y Educación, Madrid, Spain |
| Degree: PhD |
| Research interests: Running, endurance training, strength training |
| E-mail: jdelcampovecino@yahoo.es |
| |
|
Pedro Jiménez-Reyes |
| Employment: Centre for Sport Studies, Rey Juan Carlos University, Madrid, Spain |
| Degree: PhD |
| Research interests: Sprint, biomechanics, strength training |
| E-mail: pedro.jimenezr@urjc.es |
| |
|
Santiago Veiga-Fernández |
| Employment: Departamento de Deportes, Universidad Politécnica de Madrid, Madrid, Spain |
| Degree: PhD |
| Research interests: Swimming, biomechanics, competition analysis |
| E-mail: santiago.veiga@upm.es |
| |
|
| |
| REFERENCES |
 Abdel-Aziz, Y.I. and Karara, H.M. (1971) Direct linear transformation
from comparator coordinates into object space coordinates in
close-range photogrammetry. ASP Symposium on Close-Range
Photogrammetry. Proceedings. Washington, D.C., American
Society of Photogrammetry. 1-18. |
Barnes K.R., McGuigan M.R., Kilding A.E. (2014) Lower-body determinants of running economy in male and female distance runners. Journal of strength and conditioning research 28, 1289-1297. Crossref |
Bernstein, N.A. (1967) The co-ordination and regulation of movements.
Oxford; New York: Pergamon Press. |
Bushnell T., Hunter I. (2007) Differences in technique between sprinters and distance runners at equal and maximal speeds. Sports Biomechanics 6, 261-268. Crossref |
Cavagna G.A. (2006) The landing-take-off asymmetry in human running. The Journal of experimental biology 209, 4051-4060. Crossref |
Chollet, D. and Seifert, L. (2011) Inter-limb coordination in the four
competitive strokes. The world book of swimming: from science
to performance. Eds: Seifert, L., Chollet, D. and Mujika I. Nova
Science Publishers, Hauppauge, New York 153-172. |
Chow J.W., Knudson D.V. (2011) Use of deterministic models in sports and exercise biomechanics research. Sports Biomechanics 10, 219-233. Crossref |
De Wit B., De Clercq D., Aerts P. (2000) Biomechanical analysis of the stance phase during barefoot and shod running. Journal of Biomechanics 33, 269-278. Crossref |
Dorn T.W., Schache A.G., Pandy M.G. (2012) Muscular strategy shift in human running: dependence of running speed on hip and ankle muscle performance. Journal of Experimental Biology 215, 1944-1956. Crossref |
Floria P., Sanchez-Sixto A., Ferber R., Harrison A.J. (2018) Effects of running experience on coordination and its variability in runners. Journal of Sports Sciences 36, 272-278. Crossref |
Floria P., Sanchez-Sixto A., Harrison A.J., Ferber R. (2019) The effect of running speed on joint coupling coordination and its variability in recreational runners. Human Movement Science 66, 449-458. Crossref |
Foch E., Milner C.E. (2019) Influence of Previous Iliotibial Band Syndrome on Coordination Patterns and Coordination Variability in Female Runners. Journal of Applied Biomechanics 35, 305-311. Crossref |
Hamill J., van Emmerik R.E., Heiderscheit B.C., Li L. (1999) A dynamical systems approach to lower extremity running injuries. Clinical Biomechanics (Bristol, Avon) 14, 297-308. Crossref |
Haugen T., Danielsen J., Alnes L.O., McGhie D., Sandbakk Ø., Ettema G. (2018) On the Importance of "Front-Side Mechanics" in Athletics Sprinting. International Journal of Sports Physiology and Performance 13, 420-427. Crossref |
Hughes, M. and Franks, I.M. (2004) Notational Analysis of Sport:
Systems for Better Coaching and Performance in Sport.
Routledge. |
Hunter J.P., Marshall R.N., McNair P.J. (2004) Interaction of step length and step rate during sprint running. Medicine and Science in Sports and Exercise 36, 261-271. Crossref |
Jones A.M., Burnley M., Black M.I., Poole D.C., Vanhatalo A. (2019) The maximal metabolic steady state: redefining the 'gold standard'. Physiological Reports 7, e14098. Crossref |
Kakehata G., Goto Y., Iso S., Kanosue K. (2021) Timing of Rectus Femoris and Biceps Femoris Muscle Activities in Both Legs at Maximal Running Speed. Medicine and Science in Sports and Exercise 53, 643-652. Crossref |
Kivi D.M., Maraj B.K., Gervais P. (2002) A kinematic analysis of high-speed treadmill sprinting over a range of velocities. Medicine and Science in Sports and Exercise 34, 662-666. Crossref |
Knudson D.V. (1999) Validity and reliability of visual ratings of the vertical jump. Perceptual and Motor Skills 89, 642-648. Crossref |
Lussiana T., Patoz A., Gindre C., Mourot L., Hébert-Losier K. (2019) The implications of time on the ground on running economy: less is not always better. The Journal of Experimental Biology 222. Crossref |
Mann R., Herman J. (1985) Kinematic Analysis of Olympic Sprint Performance: Men's 200 Meters. International Journal of Sport Biomechanics 1, 151-162. Crossref |
McMillan, S. and Pfaff, D. (2018) The ALTIS Kinogram Method Ebook., ALTIS.
|
Miyashiro K., Nagahara R., Yamamoto K., Nishijima T. (2019) Kinematics of Maximal Speed Sprinting With Different Running Speed, Leg Length, and Step Characteristics. Frontiers in Sports and Active Living 1. Crossref |
Patoz A., Lussiana T., Breine B., Gindre C., Malatesta D., Hébert-Losier K. (2022) Examination of running pattern consistency across speeds. Sports Biomechanics , 1-15. Crossref |
Patoz A., Lussiana T., Thouvenot A., Mourot L., Gindre C. (2020) Duty Factor Reflects Lower Limb Kinematics of Running. Applied Sciences 10, 8818-. Crossref |
Payton, C.J. and Bartlett, R. (2008) Biomechanical evaluation of
movement in sport and exercise: the British Association of Sport
and Exercise Sciences guidelines. Routledge. Crossref |
Piasenta, J. (1994) Apprendre à observer: plaidoyer pour une formation
à l'observation du comportement du sportif. INSEP publications. |
Schache A.G., Brown N.A., Pandy M.G. (2015) Modulation of work and power by the human lower-limb joints with increasing steady-state locomotion speed. The Journal of Experimental biology 218, 2472-2481. Crossref |
Schache A.G., Dorn T.W., Williams G.P., Brown N.A., Pandy M.G. (2014) Lower-limb muscular strategies for increasing running speed. The Journal of Orthopaedic and Sports Physical therapy 44, 813-824. Crossref |
Seifert L., Schnitzler C., Aujouannet Y., Carter M., Rourard A., Chollet D. (2006) Comparison of subjective and objective methods of determination of stroke phases to analyse arm coordination in front-crawl. Biomechanics and Medicine in Swimming X 6, 92-94. |
Takabayashi T., Edama M., Nakamura M., Nakamura E., Inai T., Kubo M. (2017) Gender differences associated with rearfoot, midfoot, and forefoot kinematics during running. European Journal of Sport Science 17, 1289-1296. Crossref |
van Oeveren B.T., de Ruiter C.J., Beek P.J., van Dieën J.H. (2021) The biomechanics of running and running styles: a synthesis. Sports Biomechanic , 1-39. Crossref |
Wheat, J. and Glazier, P. (2006) Measuring Coordination and Variability
in Coordination. In: Movement System Variability. Eds: Davids,
K., Bennett, S. and Newell, K. Human Kinetics. 167-181. Crossref |
Williams K.R., Cavanagh P.R. (1987) Relationship between distance running mechanics, running economy, and performance. Journal of applied physiology (1985) 63, 1236-1245. Crossref |
Williams K.R., Cavanagh P.R., Ziff J.L. (1987) Biomechanical studies of elite female distance runners. International journal of sports medicine 8, 107-118. Crossref |
Yada K., Ae M., Tanigawa S., Ito A., Fukuda K., Kijima K. (2011) Standard motion of sprint running for male elite and student sprinters. Portuguese Journal of Sports Sciences 11, 583-585. |
|
| |
|
|
|
|


