|
|
|
| |
| ABSTRACT |
|
The objective was to determine the test-retest reliability and concurrent validity of a drone system in comparison to a radar device. Seventeen male collegiate soccer players participated in two maximal 30-meter sprint runs. The test-retest reliability of the drone system was evaluated using intraclass correlation coefficients (ICC3,1), coefficient of variation (CV%), and standard error of measurement (SEM). Subsequently, the systematic bias and consistency of the two devices on various force-velocity (F-V) variables (e.g., maximal velocity [Vmax], theoretical maximal velocity [V0], theoretical maximal horizontal force [F0], the slope of the F-V relationship [SFV]) were evaluated using linear mixed model (LMM) and Bland-Altman analysis. The drone system demonstrated moderate to excellent test-retest reliability across all variables (0.59 ≤ ICC ≤ 0.95; CV% < 10%). While LMM analysis detected significant systematic differences for Vmax (p = 0.013) and V0 (p = 0.012), Bland-Altman analysis confirmed high practical agreement with minimal bias (≤ 1.12%) and narrow limits of agreement (LoA < 10%). Pmax, split times (T5m–T20m) and average accelerations (A10m–A20m) demonstrated greater consistency (%Bias ≤ 0.76%) with no significant systematic bias (p > 0.05). Conversely, early-acceleration and model-derived metrics (Tau, Amax, F0, SFV) exhibited significant bias (p ≤ 0.028) and wide LoA exceeding 10% (e.g., F0: -13.37% to 8.56%; SFV: -11.54% to 18.18%). In conclusion, although the drone system exhibits high monitoring value in the maximum speed phase, early-acceleration metrics (Amax, F0, and T5m) should be interpreted with caution for individual-level monitoring. The tracking instability during the early acceleration phase necessitates further algorithm optimization. |
| Key words:
Computer vision, acceleration, performance, reliability
|
Key
Points
- The study evaluated a consumer-grade drone system for sprint force-velocity profiling against a radar using multi-faceted statistical analyses (ICC, CV%, SEM, LMM, Bland-Altman).
- The drone system demonstrated moderate-to-excellent reliability (ICC: 0.59–0.95) and high practical agreement in the maximum speed phase (bias ≤ 1.12%; LoA < 10%), but exhibited significant systematic bias during the initial acceleration phase.
- While suitable for group-level monitoring of maximum velocity metrics, the identified early-phase tracking instability provides clear targets for algorithm optimization in future drone-based sports technology applications.
|
High intensity actions in soccer encompass a broad spectrum of movements, including curvilinear sprints (Grazioli et al., 2024), change of direction actions (Morgan et al., 2022), and decelerations (Harper et al., 2019; Silva et al., 2023; Morgans et al., 2025); however, linear advancing motion (e.g., sprint) is the most frequently performed action before scoring in soccer games (Faude et al., 2012; Martínez-Hernández et al., 2023). Sprint test is widely used in practice as part of a testing battery (Dobbin et al., 2018; Taylor et al., 2022; Asimakidis et al., 2024). A deep understanding of the mechanics of sprint running is crucial not only for evaluating athletic performance but also as a key factor in injury prevention (Morin et al., 2015; Mendiguchia et al., 2016; Edouard et al., 2021). Since the development of a simple method for estimating sprint mechanical properties (Samozino et al., 2016), a growing body of research has adopted this approach to assess athletes' sprint force-velocity (F-V) profiles (Zhang et al., 2021; Galantine et al., 2023; Alonso-Callejo et al., 2024). Concurrently, numerous studies have investigated the validity and reliability of different measurement devices—such as radar device (Simperingham et al., 2019), laser gun (Ghigiarelli et al., 2022), mobile phone application (de Barros Sousa et al., 2025), GPS device (Clavel et al., 2022), photocell (Haugen et al., 2020), and linear encoder (Feser et al., 2022)—for determining these F-V variables in athletic populations. Although more affordable than laboratory equipment, radars, photocells, and GPS devices remain financially burdensome for grassroots clubs and face practical limitations. Photocells provide only sparse data, compromising the precision of F-V relationship analysis. While radar accurately measures peak speed (Beato et al., 2018; Ellens et al., 2025), it restricts tracking to a single athlete, whereas vision-based drone systems offer the potential for simultaneous multi-athlete tracking. Similarly, the accuracy of GPS devices is compromised by satellite signal quality and frequency limitations. Recent advances in computer vision have led to significant improvements in object detection algorithms. Computer vision technology has been widely adopted in autonomous vehicles (Zablocki et al., 2022) and industrial automation (Haffner et al., 2024), with rapidly growing applications in sports (Host and Ivašić-Kos, 2022). In these sports applications, a critical methodological distinction exists between pose estimation models and bounding box-based tracking. Pose estimation models focus on the localization of specific anatomical landmarks to track individual body segments for biomechanical analysis (e.g., Della Villa et al., 2022; Straub and Powers, 2022). Conversely, bounding box approaches identify the athlete as a single entity—often utilizing segmentation algorithms to distinguish movement from a static background—to quantify global displacement parameters such as instantaneous velocity (e.g., Saini et al., 2019; Reveret et al., 2020; Tran et al., 2024). Currently, drones have been applied in various sports for performance monitoring and tactical analysis (Reveret et al., 2020; Russomanno et al., 2022; Tran et al., 2024). Compared to traditional fixed cameras, drone-based tracking systems can effectively overcome the perspective limitations of fixed cameras (Tran et al., 2024). These applications support the potential of drone technology for velocity assessments in dynamic sports scenarios. To expand current testing methodologies, we propose an integrated motion analysis approach (hereafter referred to as the drone system) combining drone-based aerial videography with a computer vision model to track players performing 30-meter maximal sprints. We hypothesized that i) the sprint F-V profile variables derived from the drone method would exhibit acceptable test-retest reliability; ii) the sprint F-V profile variables calculated from the drone would exhibit a high level of agreement compared with the radar system. ParticipantsSeventeen male collegiate soccer players (age: 19.3 ± 1.4 yrs; body mass: 72.1 ± 8.0 kg; height: 177.0 ± 6.4 cm) provided written informed consent prior to participation. The study was approved by the local ethics committee of Shanghai University of Sport, in accordance with the standards of the Declaration of Helsinki (Approval Number: 102772025RT187).
Sample sizeThe sample size for this study was determined a priori based on the primary study hypothesis regarding the test-retest reliability of the drone system. According to the reliability sample size calculation method proposed by Walter et al. (1998), the minimum acceptable reliability (null hypothesis) was set at an intraclass correlation coefficient (ICC) of 0.50, corresponding to the threshold for poor reliability (Koo and Li, 2016). Aiming for an excellent level of reliability, the expected ICC (alternative hypothesis) was set at 0.90. With an alpha level of 0.05, a statistical power of 80%, and two repeated testing trials, a minimum of 13 participants was required.
ProceduresAll participants wore the same soccer boots they wore in daily training on an outdoor artificial turf field during afternoon training hours. After an identical warm-up (jogging, dynamic stretching, and three progressive submaximal sprints), each participant performed two 30-meter maximal sprints. Sprints began from a stationary split stance 50 cm behind the starting line, with no countermovement permitted, and were separated by a 3-minute recovery period. A Stalker ATS II radar system (Applied Concepts Inc., Dallas, TX, USA) was positioned on a tripod (0.9 m above the ground) approximately 5 m behind the start line, consistent with the placement protocols used in previous sprint profiling studies (Fornasier-Santos et al., 2022; Vantieghem-Nicolas et al., 2023). The study employed a DJI Air 3s Drone (SZ DJI Technology Co., Ltd.) with a DJI RC controller. Videos were captured at 60 Hz (4K resolution: 3840 × 2160 pixels) using a fixed 24 mm focal length lens without zoom, under clear weather conditions. All flights were conducted in a legally compliant area in accordance with local drone regulations, and the drone was operated by an experienced pilot throughout the data collection process. A 30×2 m rectangular runway was marked out using training cones, while the drone maintained stable hovering at 32 m altitude above the central test point (Figure 1). Recording commenced prior to the test, with the flight sequence documented for post-processing. Four backup batteries ensured continuous operation, with tests paused for battery replacement before depletion (approximately 30-minute flight time per battery).
Data ProcessingRadar data processing
Raw radar data were acquired at 46.875 Hz using a customized software (MookyStalker v3.0.21). The raw radar data outliers were manually deleted following established methods from previous study (Simperingham et al., 2019).
Video data processingAll drone-based video processing tasks were executed in a Python 3.12.7 computational environment. The analysis pipeline was implemented using OpenCV (v4.11.0), NumPy (v2.1.2), and PyTorch (v2.7.0). The data processing workflow comprised the following six sequential stages (see the pipeline overview in Figure 2):
(1) Video segmentation. The recorded videos were segmented into 10-second clips based on the test recordings.
(2) Video stabilization. A video stabilization algorithm combining AKAZE feature detection (Accelerated KAZE), FLANN feature matching (Fast Library for Approximate Nearest Neighbors), and the homography matrix was employed to mitigate shake caused by minor movements and rotations, or scale variations (due to altitude fluctuations) during filming for each video segment.
(3) Object detection model training. A single-stage object detection model (YOLOv8s, https://docs.ultralytics.com/models/yolov8/) was then trained to recognize players from a bird’s-eye view. The YOLOv8s model was initialized with pre-trained weights from Ultralytics. To ensure robust athlete detection under various dynamic postures, a total of 3,200 annotated images were utilized for model fine-tuning. These images were randomly extracted from the 30-meter sprint trials as well as supplementary athletic tests conducted concurrently with the same cohort of participants. The dataset was partitioned into training (70%, n = 2,240), validation (20%, n = 640), and testing (10%, n = 320) sets.
(4) YOLOv8s-based athlete tracking. The trained model was utilized to track the geometric center of the bounding box for each athlete.
(5) Coordinate transformation. The positional coordinates in the videos were mapped to real-world coordinates using a perspective transformation algorithm, based on calibration markers placed on the ground. Calibration rectangles, sized at 30×2 m, were manually annotated, and the homography matrix was optimized using the perspective transformation algorithm to ensure robust mapping ( Figure 2).
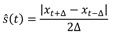
(6) Velocity calculation. The raw time-position data extracted from the video system was subsequently processed into time-velocity data ( Figure 3) for calculating sprint F-V profiles. Given that the focus of this study is on 30-meter sprint, which aligns with a single direction (the X-axis), we exclusively utilized X-position data for calculation. To mitigate the impact of measurement error on speed, we adopted the method proposed in Wu and Swartz ( 2023) by adjusting the time increment Δ in Equation 1.
 |
|
(1) |
where ŝ(t) is the estimated velocity (m·s-1) at time t; xt+Δ and xt-Δ are the X-axis positions (m) at times t + Δ and t - Δ, respectively; and 2Δ indicates the duration of the time window used for the velocity calculation. In the present study, Δ was set to 0.25 s (15 frames at the 60 Hz sampling rate). By computing velocity over this extended time window (2Δ = 0.5 s), we effectively reduced the impact of data noise on instantaneous speed estimates, thereby obtaining more stable and reliable athlete speed profiles.
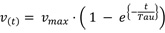
Sprinting F-V profileA customized MATLAB script (version R2021a; MathWorks, Inc., Natick, MA, USA) was developed to compute individualized linear F-V profiles by implementing an exponential model fitting protocol based on the methodology of Morin et al., (2019). All data points below 0.5 m·s-1 were discarded (Fornasier-Santos et al., 2022), with the remaining segment, up to the peak velocity, being used for model fitting. The refined mathematical model was subsequently extrapolated to estimate the movement onset across all sprint trials through forward prediction algorithms. The F-V parameters were derived based on the following model:
 |
|
(2) |
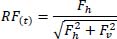
with Vmax the maximal velocity (m·s-1) reached at the end of the acceleration, Tau the acceleration time constant (s). The horizontal force (Fh) and the ratio of force (RF) were calculated using the following equations:
 |
|
(3) |
 |
|
(4) |
Finally, the theoretical maximal horizontal force (F0) and theoretical maximal horizontal velocity (V0) were used to enable the calculation of both maximum power output (Pmax) and the slope of the F-V relationship (SFV):
|
|
(5) |
 |
|
(6) |
The model-predicted cumulative sprint distance was calculated from the fitted velocity curve using cumulative trapezoidal numerical integration. Times to reach 5 m (T5m), 10 m (T10m), 15 m (T15m), and 20 m (T20m) were defined as the time instants at which the cumulative distance first reached the corresponding distance values. Average accelerations (A5m, A10m, A15m, A20m) were then calculated as the ratio between mean velocity and the time variation between the start and the corresponding reach times (T5m, T10m, T15m, and T20m).
Statistical analysisData are presented as mean ± standard deviation (SD). Test-retest reliability for both radar and drone systems was assessed using intraclass correlation coefficients (ICC3,1) with 95% confidence intervals, the coefficient of variation (CV%) and the standard error of measurement (SEM = SD × √(1 - ICC)). The interpretation of ICC values adhered to the guidelines proposed by Koo and Li (2016): values below 0.50 indicated poor reliability, 0.50–0.75 moderate, 0.75–0.90 good, and above 0.90 excellent. The magnitude of change was interpreted using the minimal detectable change (MDC95 = 1.96 × √2 × SEM) and the smallest worthwhile change (SWC = 0.2 × between-subject SD). The MDC95 represents the smallest change exceeding measurement error and is used to determine whether an observed change in an individual is real; the SWC reflects the smallest practically meaningful change. Concurrent validity between the radar and drone systems was assessed using Bland-Altman analysis, reporting mean bias, 95% Limits of Agreement (LoA), and bias percentage (Bias%) (Giavarina, 2015). When compared between different devices, metrics with a bias of less than 5% and a narrow LoA (< 10% of mean) were considered to show good agreement; conversely, metrics with greater bias or a wider LoA were interpreted as having poorer consistency between the devices (Cormier et al., 2023; Dawson et al., 2026). A linear mixed model (LMM) analyzed the fixed effects of device (Radar vs. Drone) and trial (Trial 1 vs. Trial 2), and their interaction on all F-V variables, with subject as a random intercept. Non-significant interactions were removed from final models. Post-hoc comparisons utilized Tukey-adjusted estimated marginal means. Effect sizes were reported as partial eta-squared (ηp2). Statistical analysis was conducted using R (version 4.5.1, R Core Team, Vienna, Austria) at p < 0.05.
Test-retest reliabilityDrone system ICC values ranged from 0.59 to 0.95, while radar system values were higher (0.73–0.97). Both systems achieved excellent reliability (ICC > 0.90) for Vmax, V0, and late-phase acceleration kinematics (A15m, A20m), but showed lower stability for early acceleration variables such as Amax, F0 and T5m (Table 1).
Concurrent validityMaximum velocity and kinematic time variables exhibited strong absolute agreement (high R2), whereas early acceleration variables (e.g., F0, Amax) showed greater dispersion and proportional bias (Figure 4). Most metrics (Vmax, V0, Pmax, RFmax, T5m, T10m, T15m, T20m, A5m, A10m, A15m, A20m) were classified as Good agreement (%Bias < 5%, LoA < 10%) between systems (Table 2 and Figure 5). Significant device main effects (Table 3) showed that the drone overestimated Tau, Vmax, V0, and SFV, while underestimating Amax, F0, RFmax, and A5m. No significant differences were observed for Pmax, T5m, T10m, T15m, T20m, A10m, A15m, or A20m (p > 0.05).
The purpose of this study was to evaluate the feasibility of a drone-based vision system for measuring short-sprint performance and F-V profiles. Overall, the drone system demonstrated moderate-to-excellent test-retest reliability and good concurrent validity with the radar system for most F-V variables. However, early-acceleration and model-derived variables showed only moderate reliability (e.g., Amax, F0, T5m) and poor concurrent validity (Tau, Amax, F0, SFV) between devices. Both systems demonstrated moderate-to-excellent test-retest reliability across most F-V variables. However, the drone system returned only moderate ICC values for early-acceleration metrics, including Amax, F0, RFmax, T5m, T10m, and A5m (ICC = 0.61, 0.61, 0.63, 0.59, 0.70, and 0.71, respectively), whereas the radar system achieved Good reliability for these same variables (ICC = 0.73, 0.73, 0.73, 0.83, 0.84, and 0.84, respectively). Across all variables, MDC95 values exceeded the SWC, indicating that neither system provides sufficient sensitivity for detecting small individual changes. This limitation was particularly pronounced for early-acceleration metrics such as F0 and T5m, whose lower reliability is not unique to the drone system. This finding is consistent with previous reliability studies on F0 and T5m using radar (Simperingham et al., 2019) and laser (Ghigiarelli et al., 2022). The calculation of F0 relies on the initial phase of sprint acceleration, where speed data inherently exhibit high noise and variability (Simperingham et al., 2019). This is in line with previous studies that reported only moderate intra-day reliability for laser-derived F0 (CV = 7.8%, ICC = 0.64; Buchheit et al., 2014) and radar-derived F0 (CV = 6.9%, ICC = 0.70; Simperingham et al., 2019). The lower reliability observed in these early-acceleration metrics likely reflects the biomechanical variability inherent to initial acceleration, where unstable velocity data capture contributes to greater measurement inconsistency. Specifi-cally, the top-down perspective inherently limits accurate center-of-mass estimation, as the bounding box centroid shifts with rapid postural transitions. Additionally, as the athlete accelerates, rapid postural transitions cause the bounding box dimensions to fluctuate frame-by-frame. This morphological instability introduces high-frequency noise into the positional data, degrading the accuracy of derived horizontal force metrics. The Bland-Altman analysis revealed varying levels of agreement across sprint mechanical variables. While Vmax, V0, Pmax, RFmax, all split-time intervals (T5m–T20m), and all average acceleration metrics (e.g., A5m–A20m) showed good agreement with minimal bias (< 5%) and narrow limits of agreement (< 10%), early-acceleration and model-derived metrics (Tau, SFV, Amax, F0) demonstrated poor agreement, exhibiting wider limits of agreement (> 10%). For initial-acceleration-related metrics (Amax, F0), the observed lower agreements primarily stem from two sources: (i) tracking instability during trunk-angle progression: as the upper body inclines through acceleration (Nagahara et al., 2014), continuous shifts of visual recognition bounding boxes degrade force estimation. The drone system exhibited stronger biases for initial-acceleration-related variables, specifically F0 and Amax. This discrepancy likely originates from the kinematic transition of the tracking centroid during the explosive start. During the first 5 m, athletes transition from a deep forward lean to an upright posture. While the radar consistently tracks a reflection point on the lower back, the drone algorithm calculates the centroid of a 2D bounding box. As the athlete’s trunk rotates upward, this geometric center shifts relative to the actual center of mass. This physical reference point drift explains the significant negative estimate for F0 and suggests that tracking stability in the first few strides remains a technical challenge. Critically, Bezodis et al. (2012) demonstrated that posture changes induce substantial measurement error, noting a 0.25 m forward shift of the lumbar tracking point relative to the COM within the first second of sprinting that caused significant velocity discrepancies (Bias = +0.41 m·s-1, random error = ±0.18 m·s-1 at 1 m). These extreme postural changes pose a greater challenge for the YOLO model in this study. This is because the geometric center of its detected bounding box may deviate substantially from the athlete's actual biological COM, thereby leading to greater errors (Figure 6). (ii) due to the inherent nature of 2D perspective projection, dynamic changes in the athlete's 3D position relative to the camera can distort the perceived 2D displacement. As illustrated in Figure 6, even when the center point of the detection bounding box is identified, its mapped position in real-world coordinates may deviate from the athlete's actual center of mass (COM) location. This error becomes particularly pronounced as the athlete accelerates forward and their distance from the camera's optical axis changes, especially during the initial acceleration phase. Similarly, the acceleration time constant (Tau), which quantifies sprint initiation kinetics (Morin et al., 2019), and the slope of the force-velocity relationship (SFV = -F0/V0) were also influenced by initial acceleration measurement errors. As highlighted in recent visual tracking literature (Yang and Gu, 2023), standard tracking algorithms often struggle to maintain precise localization during significant target appearance changes without advanced bounding box refinement. In this study, these uncorrected fluctuations disrupted the spatial precision required for capturing rapid kinematic transitions. Taken together, the Bland-Altman and LMM analyses converged on consistent findings. For parameters dependent on the initial acceleration—specifically Tau, Amax, F0, and SFV—the drone and radar systems should not be used interchangeably. LMM analysis confirmed significant systematic bias (p ≤ 0.028, ηp2 = 0.094–0.129, moderate effect; Cohen, 1988). More critically, the Bland-Altman limits of agreement (LoA) exceeded the 10% threshold, which is regarded as the upper limit for acceptable measurement error in athletic performance monitoring (Cormier et al., 2023). This lack of agreement suggests that the drone's vision-based tracking struggles with the high-frequency kinematic changes and extreme trunk lean characteristic of the first few strides. In contrast, a seemingly contradictory finding emerged for variables such as Vmax, V0, RFmax, and A5m; while LMM results showed statistically significant differences (p < 0.05) and moderate effect sizes (e.g., Vmax, ηp2 = 0.120), their consistency was categorized as Good. This reflects a familiar point in sports biostatistics: a significant LMM p-value often indicates the consistency of a bias rather than its magnitude. As noted by Atkinson and Nevill (1998), statistical significance can be achieved with even trivial differences if the measurement precision is high and the bias is systematic. For Vmax, although the bias was statistically stable, its absolute magnitude was negligible (bias = 0.96%, LoA < 10%), falling well within the bounds of practical utility. Finally, for the remaining metrics (e.g., Pmax, T5m, split times T10m–T20m, and average accelerations A10m–A20m), both statistical methods yielded highly congruent results, although T5m should be interpreted with caution given its moderate test-retest reliability (ICC = 0.59). The LMM found no significant systematic bias (p > 0.05, ηp2 ≤ 0.074) and Bland-Altman analysis confirmed extremely low bias (e.g., A20m, bias = 0.09%). This overarching pattern suggests that the drone system reaches its peak evaluative accuracy once the athlete achieves a more stable upright posture and consistent velocity. LimitationsSeveral limitations exist. First, the sample size (n = 17) limits the generalizability of the findings. Second, only two sprint trials were conducted per session, which constrains the robustness of test-retest reliability estimates. Third, the conversion from 2D pixel coordinates to 3D real-world coordinates is susceptible to perspective projection errors, particularly during dynamic postural changes. Future research should implement multi-camera setups for stereoscopic triangulation or integrate human pose estimation to track specific anatomical landmarks (e.g., the hip) rather than bounding box centroids, thereby minimizing errors caused by dynamic postural changes. Additionally, drone deployment requires compliance with local airspace regulations and should be operated by an experienced pilot to ensure the safety of athletes and bystanders, which may limit its feasibility in some training environments.
In conclusion, the drone system demonstrates moderate to excellent test-retest reliability for most sprint F-V variables, indicating the potential for repeated assessment of sprint F-V profiles. In addition, the results show that several key F-V variables, particularly those related to the acceleration phase at the start (e.g., Tau, Amax, F0, SFV), exhibit statistically significant and practically meaningful systematic biases, making them unsuitable for interchangeable use. Conversely, variables related to speed (Vmax and V0), split times (T5m–T20m), and average accelerations (A10m, A15m, and A20m) show good practical agreement. However, caution is warranted for individual-level monitoring across all variables, as MDC95 values consistently exceeded the SWC, with this limitation being most pronounced for early-acceleration metrics (Amax, F0, and T5m). Researchers and practitioners should be mindful of these phase-specific discrepancies and measurement limitations when selecting and interpreting data from these technologies. Further research should explore the potential applications of the drone-based systems in investigating athletes’ turning abilities (e.g., curve sprinting), which has significant practical value for evaluating performance in team sports.
| ACKNOWLEDGEMENTS |
We are grateful for the help of all the coaches and the athletes who enthusiastically participated in our measurements. We would particularly like to thank Coach Fei Zhou for his invaluable assistance in organizing the sprint testing. This study was supported by the Shanghai Key Lab of Human Performance (Shanghai University of Sport, NO.11DZ2261100). During the preparation of this work the authors used Gemini to polish the English language and improve readability. After using this tool, the authors reviewed and edited the content as needed and take full responsibility for the content of the publication. The datasets generated during the current study are not publicly available but are available from the corresponding author upon reasonable request. The authors declare that they have no conflict of interest. All experimental procedures were conducted in compliance with the relevant legal and ethical standards of the country where the study was carried out. |
|
| AUTHOR BIOGRAPHY |
|
 |
Fahui Wang |
| Employment: Université Lyon 1, LIBM, UR7424, Lyon, France |
| Degree: Ph.D. |
| Research interests: Sports Biomechanics |
| E-mail: fahui.wang@etu.univ-lyon1.fr |
| |
 |
Christophe Hautier |
| Employment: Université Lyon 1, LIBM, UR7424, Lyon, France |
| Degree: Ph.D. |
| Research interests: Sports Biomechanics |
| E-mail: christophe.hautier@univ-lyon1.fr |
| |
 |
Lin Song |
| Employment: School of Athletic Performance, Shanghai University of Sport |
| Degree: MSc |
| Research interests: Video Analysis of Athletic Performance |
| E-mail: songlinccc@hotmail.com |
| |
 |
Yong Zhou |
| Employment: School of Athletic Performance, Shanghai University of Sport |
| Degree: MSc |
| Research interests: Football performance |
| E-mail: 2421852068@sus.edu.cn |
| |
 |
Brice Guignard |
| Employment: Université Lyon 1, LIBM, UR7424, Lyon, France |
| Degree: Ph.D. |
| Research interests: Biomechanics, Human Motion Analysis & Sport Performance |
| E-mail: brice.guignard@univ-lyon1.fr |
| |
 |
Paul Glaise |
| Employment: Université Lyon 1, LIBM, UR7424, Lyon, France |
| Degree: Ph.D. |
| Research interests: Applied physiology of exercise |
| E-mail: g-paul@sfr.fr |
| |
 |
Qingshan Zhang |
| Employment: School of Athletic Performance, Shanghai University of Sport |
| Degree: Ph.D. |
| Research interests: Sports Biomechanics |
| E-mail: zhang.qingshan@hotmail.com |
| |
|
| |
| REFERENCES |
 Alonso-Callejo, A., García-Unanue, J., Guitart-Trench, M., Majano, C., Gallardo, L., Felipe, J.L. (2024) Validity and reliability of the acceleration-speed profile for assessing running kinematics’ variables derived from the force-velocity profile in professional soccer players. Journal of Strength & Conditioning Research 38, 563-570. Crossref |
Asimakidis, N.D., Bishop, C.J., Beato, M., Mukandi, I.N., Kelly, A.L., Weldon, A. (2024) A survey into the current fitness testing practices of elite male soccer practitioners: From assessment to communicating results. Frontiers in Physiology 15, 1376047. Crossref |
Atkinson, G., Nevill, A.M. (1998) Statistical methods for assessing measurement error (reliability) in variables relevant to sports medicine. Sports Medicine 26, 217-238. Crossref |
Beato, M., Coratella, G., Stiff, A., Iacono, A.D. (2018) The validity and between-unit variability of GNSS units (STATSports apex 10 and 18 hz) for measuring distance and peak speed in team sports. Frontiers in Physiology 9, 1288. Crossref |
Bezodis, N., Salo, A.I., Trewartha, G. (2012) Measurement error in estimates of sprint velocity from a laser displacement measurement device. International Journal of Sports Medicine 33, 439-444. Crossref |
Buchheit, M., Samozino, P., Glynn, J. A., Michael, B. S., Al Haddad, H., Mendez-Villanueva, A., Morin, J.-B. (2014) Mechanical determinants of acceleration and maximal sprinting speed in highly trained young soccer players. Journal of Sports Sciences 32, 1906-1913. Crossref |
Clavel, P., Leduc, C., Morin, J.-B., Owen, C., Samozino, P., Peeters, A., Buchheit, M., Lacome, M. (2022) Concurrent validity and reliability of sprinting force-velocity profile assessed with GPS devices in elite athletes. International Journal of Sports Physiology & Performance 17, 1527-1531. Crossref |
Cohen, J. (1988) Statistical Power Analysis for the Behavioral Sciences. 2nd ed. Hillsdale, NJ: Lawrence Erlbaum Associates, Publishers. Crossref |
Cormier, P., Tsai, M.-C., Meylan, C., Agar-Newman, D., Epp-Stobbe, A., Kalthoff, Z., Klimstra, M. (2023) Concurrent validity and reliability of different technologies for sprint-derived horizontal force-velocity-power profiling. Journal of Strength and Conditioning Research 37, 1298-1305. Crossref |
Dawson, L., McErlain-Naylor, S.A., Devereux, G., Beato, M. (2026) Interunit reliability of STATSports APEX global navigation satellite system and accelerometer-derived metrics during shuttle run protocols of varied distances and change of direction frequency. Journal of Sports Sciences 44, 117-129. Crossref |
de Barros Sousa, F. A., Henrique Marinho, A., da Silva Calvalcante, M. D., de Almeida Rodrigues, N., Silva Lima, T., Gilo da Silva, D., Fonseca, F. D. S., Balikian Junior, P., Gomes de Araujo, G. (2025) Running sprint force-velocity-power profile obtained with a low-cost and low frame rate acquisition video technique: reliability and concurrent validity. Sports Biomechanics 24, 1957-1973. Crossref |
Della Villa, F., Di Paolo, S., Santagati, D., Della Croce, E., Lopomo, N. F., Grassi, A., Zaffagnini, S. (2022) A 2D video-analysis scoring system of 90° change of direction technique identifies football players with high knee abduction moment. Knee Surgery, Sports Traumatology, Arthroscopy 30, 3616-3625. Crossref |
Dobbin, N., Hunwicks, R., Highton, J., Twist, C. (2018) A reliable testing battery for assessing physical qualities of elite academy rugby league players. Journal of Strength and Conditioning Research 32, 3232-3238. Crossref |
Edouard, P., Lahti, J., Nagahara, R., Samozino, P., Navarro, L., Guex, K., Morin, J.-B., Mendiguchia, J. (2021) Low Horizontal Force Production Capacity during Sprinting as a Potential Risk Factor of Hamstring Injury in Football. International Journal of Environmental Research and Public Health 18, 7827. Crossref |
Ellens, S., Moran, C., Varley, M.C. (2025) Concurrent validity and between-device reliability of the catapult vector S8 GNSS device. PLOS ONE 20, e0333792. Crossref |
Faude, O., Koch, T., Meyer, T. (2012) Straight sprinting is the most frequent action in goal situations in professional football. Journal of Sports Sciences 30, 625-631. Crossref |
Feser, E., Lindley, K., Clark, K., Bezodis, N., Korfist, C., Cronin, J. (2022) Comparison of two measurement devices for obtaining horizontal force-velocity profile variables during sprint running. International Journal of Sports Science & Coaching 17, 1455-1461. Crossref |
Fornasier-Santos, C., Arnould, A., Jusseaume, J., Millot, B., Guilhem, G., Couturier, A., Colson, S., Rabita, G., Morin, J.B. (2022) Sprint acceleration mechanical outputs derived from position- or velocity-time data: A multi-system comparison study. Sensors 22, 8610. Crossref |
Galantine, P., Sudlow, A., Peyrot, N., Vercruyssen, F., Bélard, C., Dalleau, G., Morin, J.-B., Gimenez, P. (2023) Force-velocity profile in sprinting: sex effect. European Journal of Applied Physiology 123, 911-921. Crossref |
Ghigiarelli, J.J., Ferrara, K.J., Poblete, K.M., Valle, C.F., Gonzalez, A.M., Sell, K.M. (2022) Level of agreement, reliability, and minimal detectable change of the MusclelabTM laser speed device on force-velocity-power sprint profiles in Division II collegiate athletes. Sports 10, 57. Crossref |
Giavarina, D. (2015) Understanding Bland Altman analysis. Biochemia Medica 25, 141-151. Crossref |
Grazioli, R., Soares, M. L. H. Q., Schons, P., Preissler, A. B., Veeck, F., Benítez-Flores, S., Pereira, L. A., Loturco, I., Peyré-Tartaruga, L. A. (2024) Curve sprint performance and speed-related capabilities in professional soccer players. Journal of Bodywork and Movement Therapies 40, 1034-1040. Crossref |
Haffner, O., Kučera, E., Rosinová, D. (2024) Applications of machine learning and computer vision in Industry 4.0. Applied Sciences 14, 2431. Crossref |
Harper, D.J., Carling, C., Kiely, J. (2019) High-intensity acceleration and deceleration demands in elite team sports competitive match play: A systematic review and meta-analysis of observational studies. Sports Medicine 49, 1923-1947. Crossref |
Haugen, T., Breitschädel, F., Samozino, P. (2020) Power-force-velocity profiling of sprinting athletes: Methodological and practical considerations when using timing gates. Journal of Strength and Conditioning Research 34, 1769-1773. Crossref |
Host, K., Ivašić-Kos, M. (2022) An overview of Human Action Recognition in sports based on Computer Vision. Heliyon 8, e09633. Crossref |
Koo, T.K., Li, M.Y. (2016) A guideline of selecting and reporting intraclass correlation coefficients for reliability research. Journal of Chiropractic Medicine 15, 155-163. Crossref |
Martínez-Hernández, D., Quinn, M., Jones, P. (2023) Linear advancing actions followed by deceleration and turn are the most common movements preceding goals in male professional soccer. Science and Medicine in Football 7, 25-33. Crossref |
Mendiguchia, J., Edouard, P., Samozino, P., Brughelli, M., Cross, M., Ross, A., Gill, N., Morin, J.-B., Mendez-Villanueva, A. (2016) Field monitoring of sprinting power-force-velocity profile before, during and after hamstring injury: Two case reports. Journal of Sports Sciences 34, 535-541. Crossref |
Morgan, O.J., Drust, B., Ade, J.D., Robinson, M.A. (2022) Change of direction frequency off the ball: new perspectives in elite youth soccer. Science and Medicine in Football 6, 473-482. Crossref |
Morgans, R., Mandorino, M., Ryan, B., Zmijewski, P., Moreira, A., Oliveira, R. (2025) Contextualized acceleration and deceleration profiles of elite soccer players during English premier league match-play. The effect of possession, positional demands and opponent ranking. Biology of Sport 42, 67-75. Crossref |
Morin, J.-B., Gimenez, P., Edouard, P., Arnal, P., Jiménez-Reyes, P., Samozino, P., Brughelli, M., Mendiguchia, J., Rabita, G. (2015) Sprint Acceleration Mechanics: The Major Role of Hamstrings in Horizontal Force Production. Frontiers in Physiology 6, 404. Crossref |
Morin, J.-B., Samozino, P., Murata, M., Cross, M.R., Nagahara, R. (2019) A simple method for computing sprint acceleration kinetics from running velocity data: Replication study with improved design. Journal of Biomechanics 94, 82-87. Crossref |
Nagahara, R., Matsubayashi, T., Matsuo, A., Zushi, K. (2014) Kinematics of transition during human accelerated sprinting. Biology Open 3, 689-699. Crossref |
Reveret, L., Chapelle, S., Quaine, F., Legreneur, P. (2020) 3D visualization of body motion in speed climbing. Frontiers in Psychology 11, 2188. Crossref |
Russomanno, T.G., Blauberger, P., Kolbinger, O., Lam, H., Schmid, M., Lames, M. (2022) Drone-based position detection in sports—Validation and applications. Frontiers in Physiology 13, 850512. Crossref |
Saini, N., Price, E., Tallamraju, R., Enficiaud, R., Ludwig, R., Martinovic, I., Ahmad, A., Hayat, S., Scaramuzza, D. (2019) Markerless outdoor human motion capture using multiple autonomous micro aerial vehicles. Proceedings of the 2019 IEEE/CVF International Conference on Computer Vision (ICCV). IEEE. 823-832. Crossref |
Samozino, P., Rabita, G., Dorel, S., Slawinski, J., Peyrot, N., Saez De Villarreal, E., Morin, J.B. (2016) A simple method for measuring power, force, velocity properties, and mechanical effectiveness in sprint running. Scandinavian Journal of Medicine & Science in Sports 26, 648-658. Crossref |
Silva, H., Nakamura, F.Y., Beato, M., Marcelino, R. (2023) Acceleration and deceleration demands during training sessions in football: a systematic review. Science and Medicine in Football 7, 198-213. Crossref |
Simperingham, K.D., Cronin, J.B., Pearson, S.N., Ross, A. (2019) Reliability of horizontal force-velocity-power profiling during short sprint-running accelerations using radar technology. Sports Biomechanics 18, 88-99. Crossref |
Straub, R.K., Powers, C.M. (2022) Utility of 2D video analysis for assessing frontal plane trunk and pelvis motion during stepping, landing, and change in direction tasks: A validity study. International Journal of Sports Physical Therapy 17, 139-147. Crossref |
Taylor, J.M., Madden, J.L., Cunningham, L.P., Wright, M. (2022) Fitness testing in soccer revisited: developing a contemporary testing battery. Strength & Conditioning Journal 44, 10-21. Crossref |
Tran, T., Choo, K. T. W., Foong, S., Bhardwaj, H., Win, S. K. H., Ang, W. J., Saini, N., Chakravarthula, P., Ahmad, A., Scaramuzza, D. (2024) Analyzing swimming performance using drone captured aerial videos. Proceedings of the 10th Workshop on Micro Aerial Vehicle Networks, Systems, and Applications. Minato-ku Tokyo Japan: ACM. 7-12. Crossref |
Vantieghem-Nicolas, L., Morin, J.-B., Cotte, T., Sangnier, S., Rossi, J. (2023) Concurrent validity and reliability of the sprint force-velocity profile assessed with K-AI wearable tech. Sensors 23, 8189. Crossref |
Walter, S.D., Eliasziw, M., Donner, A. (1998) Sample size and optimal designs for reliability studies. Statistics in Medicine 17, 101-110. Crossref |
Wu, L.Y., Swartz, T.B. (2023) The calculation of player speed from tracking data. International Journal of Sports Science & Coaching 18, 516-522. Crossref |
Yang, Y., Gu, X. (2023) Accurate and robust visual tracking using bounding box refinement and online sample filtering. Signal Processing: Image Communication 116, 116981. Crossref |
Zablocki, É., Ben-Younes, H., Pérez, P., Cord, M. (2022) Explainability of deep vision-based autonomous driving systems: review and challenges. International Journal of Computer Vision 130, 2425-2452. Crossref |
Zhang, Q., Pommerell, F., Owen, A., Trama, R., Martin, C., Hautier, C.A. (2021) Running patterns and force-velocity sprinting profiles in elite training young soccer players: A cross-sectional study. European Journal of Sport Science 21, 1718-1726. Crossref |
|
| |
|
|
|
|


