|
|
|
| |
| ABSTRACT |
|
Sports injuries pose significant challenges in athlete welfare and team dynamics, particularly in high-intensity sports like soccer. This study used machine learning algorithms to assess non-contact injury risk in professional male soccer players from physiological and mechanical load variables. Twenty-five professional male soccer players with a first-time, non-contact muscle injury were included in this study. Recordings of external load (speed, distance, and acceleration/deceleration data) and internal load (heart rate) were obtained during all training sessions and official matches over a 4-year period. Machine learning model training and evaluation features were calculated for each of nine different metrics for a 28-day period prior to the injury and an equal-length baseline epoch. The acute surge in the values of each workload metric was quantified by the deviation of maximum values from the average, while the variations of cumulative workload over the last four weeks preceding injury were also calculated. Seven features were selected by the model as prominent estimators of injury incidence. Three of the features concerned acute load deviations (number of sprints, training load score-incorporating heart rate and muscle load- and time of heart rate at the 90-100% of maximum). The four cumulative load features were (total distance, high speed and sprint running distance and training load score). The accuracy of the muscle injury risk assessment model was 0.78, with a sensitivity of 0.73 and specificity of 0.85. Our model achieved high performance in injury risk detection using a limited number of training load variables. The inclusion, for the first time, of heart rate related variables in an injury risk assessment model highlights the importance of physiological overload as a contributor to muscle injuries in soccer. By identifying the important parameters, coaches may prevent muscle injuries by controlling surges of training load during training and competition. |
| Key words:
Soccer, Injury, Machine Learning, Classification, Exertion, training load
|
Key
Points
- The machine learning model used seven key input training load variables that provided high accuracy classification of muscle injuries in soccer.
- Three of the variables concerned acute load deviations (number of sprints, training load score-incorporating heart rate and muscle load- and time of heart rate at the 90-100% of maximum), while the other four concerned cumulative load features (total distance, high speed and sprint running distance and training load score).
- By identifying the important parameters, coaches may prevent muscle injuries by controlling surges of training load during training and competition.
|
In high level sports, injuries hold paramount significance due to multifaceted implications in athlete welfare and team dynamics (Hägglund et al., 2013). In this regard, prevention and rehabilitation are crucial for sustaining long-term athletic vitality. Beyond individual health, injuries exert a palpable influence on team performance, prompting strategic adaptations by coaches and engendering financial considerations for clubs, particularly when key players are affected (Noya Salces et al., 2014). This is particularly evident in soccer, where the incidence of injuries is notably high due to the game's dynamics, speed, power requirements, and play patterns (Raya-González et al., 2022). Training is often associated with injuries in sports, with the relationship between training practices and injury risk being a key focus in sports science (Gabbett, 2010; Rogalski et al., 2013). The intensity and volume of training sessions and methods and the periodization of training play pivotal roles in influencing injury susceptibility (Hurley, 2016). In contemporary soccer, the increased pace and more concentrated intervals of high-intensity efforts have led to a rise in injuries (Nassis et al., 2020). Studies indicate that increased training load and improper load distribution can heighten injury risk due to factors such as overuse, fatigue, insufficient recovery, training errors, and biomechanical stress (Gabbett, 2016; Gabbett et al., 2017). Individual factors, including fitness level and movement biomechanics, also contribute to the variability in injury risk among players (Kalkhoven et al., 2021). Effective load management, balancing training stress and recovery, is crucial for optimizing performance while minimizing injury risk. Coaching practices, including injury risk screening and individualized training plans, are essential in reducing injuries during training and competition (Bourdon et al., 2017). Advancements in technology and analytical methodologies have opened new avenues for monitoring training load through wearable global positioning system (GPS) devices combined with accelerometers, gyroscopes, and heart rate monitoring systems (Ehrmann et al., 2016). These technologies offer a wide range of external and internal training load variables, relating to mechanical load imposed on the players and the corresponding physiological responses, respectively (Gabbett, 2016; Akenhead and Nassis, 2016; Silva et al., 2023). Despite the wealth of information these systems provide, the most significant variables and the appropriate methods for analyzing longitudinal data are not universally acknowledged (Bourdon et al., 2017; Gabbett et al., 2017; Khezri et al., 2022). On this premise, the Acute to Chronic Workload Ratio (ACWR) is commonly employed in the context of monitoring sports-related training loads to optimize performance and minimize injury risk (Gabbett et al., 2016). ACWR is a metric to assess the balance between short-term or “acute” workload (i.e., the workload over the past week) and long-term or “chronic” workload (i.e., the average workload over the past 4 weeks). Monitoring the ACWR helps ensuring that athletes are exposed to appropriate levels of training stress, avoiding sudden spikes or prolonged periods of high workload that may increase the risk of injuries and cause a decline in performance. However, the specific threshold values for an optimal or risky ACWR may vary, based on individual athlete characteristics, sport types, and training patterns (Suarez-Arrones et al., 2020; Bowen et al., 2020). From this viewpoint, Artificial intelligence (AI) and machine learning (ML) algorithms may be valuable in assessing injury risk in sports (Claudino et al., 2019; Van Eetvelde et al., 2021; Kumar et al., 2024). These technologies can elucidate complex relationships between various variables, providing insights into factors related to overload (Jaspers et al., 2018). While several studies have applied ML in sports, only a few focus on injury risk assessment in soccer (Nassis et al., 2023). For instance, Rommers et al., (2020) used a preseason screening test in 734 young soccer players, employing an XGBoost method to achieve 85% classification accuracy in assessing injury risk. Another study (Ayala et al., 2019), utilized oversampling and ensemble learning methods to detect hamstring strain injury risk, achieving an AUC score of 0.837, with 77.8% sensitivity and 83.8% specificity. In a similar design, López-Valenciano et al., (2018), used decision tree algorithms and cost-sensitive ADTree models to estimate muscle injury risk, achieving an AUC score of 0.747. More recently, Piłka et al., (2023) employed XGBoost decision-making methods to assess non-contact lower body injury-risk based on GPS data, and achieved a 90% accuracy. Despite the effective use of ML for identifying elevated injury risk from single-time measurements, the fluctuations in training load over extended periods may offer new insights into injury risk assessment and prevention (Rossi et al., 2021; Pillitteri et al., 2023). Rossi et al., 2018 introduced a multi-dimensional ML approach for injury risk estimation in soccer, using a large number of GPS and accelerometer data, combined with age, and play time data. Their decision tree model demonstrated a sensitivity of 0.80 and specificity of 0.50 in injury classification, offering practical rules for evaluating injury risks. Taking the above into consideration, it becomes evident that the occurrence of injuries in soccer is influenced by a complex interplay of multiple factors. The present study aims to model to non-contact injuries predistortions via ML, taking into account the deviations of training load variables from the individual player’s baseline. This is the first study to include heart rate data in the injury risk assessment model, hypothesizing that significant factors contributing to potential injuries are either singular events (substantial training load divergence on a specific day) or cumulative training load over time. Study designTraining and match load was monitored during all training sessions and official games over the last three seasons (2021-2024) in professional soccer players of the Greek Super League. Nine external and internal load metrics were collected using wearable GPS devices, integrated with an accelerometer and heart rate recording belt or vest. Data from 25 players with a first-time (i.e., within at least a 12-month period), non-contact injury were included. A 28-day epoch prior-to-the-injury was selected for feature calculation, while an equal length non-injury baseline epoch (i.e., a random period prior to the injury epoch from the same season the injury occurred) was extracted as a control period. Machine learning model training, and evaluation features were calculated for each of the different metrics for both injury and baseline epochs. Since our hypothesis states that excessive and/or unaccustomed exertion imposes a physiological burden on the athlete's body that may lead to injury, the features’ calculations intended to present the deviations from the baseline performance measurements. As such, the deviation of maximum from average (DEV) and the variation of the ACWR was calculated for each of the internal and external load metrics collected. To diminish variability, while highlighting the discriminatory capacity of the features, a feature selection framework was implemented. This facilitated the identification of the most pertinent features for classification, concurrently eliminating features that might exhibit redundancy in the subsequent classification procedures. Finally, the risk assessment model was validated for feature calculation and selection.
ParticipantsTwenty-five professional male soccer players with a first-time (i.e., within at least a 12-month period), non-contact muscle injury, were included in this study. All players were part of the starting or substitute squad of Asteras Tripolis F.C. in the Greek Super League (the domestic top professional soccer league) and played different positions (excluding the position of goalkeeper, due to the different nature of gameplay and training). Out of the 25 athletes, 11 were midfielders, 7 were full backs, 3 were Forwards and 4 were Center Backs. Considering the type of injuries included, 40% were hamstrings strains, 32% were adductor strains, 16% were calf muscle strains, and 12% were quadriceps strains. The study was approved by the Ethics Committee of the School of P.E. and Sport Science, (1275/17-03-2021) and all procedures were in accordance with the Code of Ethics of the World Medical Association (Helsinki declaration of 1964, as revised in 2013). Written informed consent was obtained from all participants.
Data collectionTraining and match load was monitored during all training sessions and official games over the last three seasons (2021-2024), i.e. 665 training session, 111 games and 173 days off, with <1.5% missing data. Of the 25 injuries, 7 occurred in the season 2021-2022, 10 in the season 2022-2023, and 8 in the season 2023-2024. Data acquisition involved the recording of the players’ physical activity, using wearable GPS devices, integrated with an accelerometer and heart rate recording belt or vest (Polar team Pro system (Polar Electro, Kempele, Finland). The sensor consists of a 10 Hz GPS unit integrated with an accelerometer, a 3D gyroscope and a separate heart rate monitoring belt or vest. The GPS devices were placed between the players’ scapulae through a tight vest or shirt. From the data collected by the devices a set of training workload indicators were extracted through the web-based software of Polar team Pro for all training sessions and games. The data comprised of dynamic player variables (such as the number of sprints, number of accelerations, number of decelerations, and total distance covered), paired with other metrics (heart rate data and derivatives such as time in heart rate zones). Specifically, from each player, 9 different metrics were used, describing different aspects of the workload in a training session or match. The metrics and their description are presented in Table 1. Figure 1 presents an example of the recorded metrics for a particular subject over a period of six weeks, prior to injury. It is important to note that although a trend can be discerned in a small number of subjects (showing the “surge” of particular metrics before the injury the last week prior to injury, Figure 1), this is not true for the majority of the participants. In fact, large increments of the recorded metrics were displayed over the weeks before injury in a more random order, thus calculating specific “cut off” points (e.g. the number of sprints, combined with elevated HSR) is ineffective to assess predisposition of the player to injury.
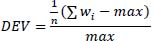
Feature calculationTo explore the time-varying training load information with respect to injury incidents, a 28-day epoch prior-to- the-injury was selected for feature calculation. In the present study, this 28-day epoch included 20.6 ± 2.4 training sessions, 3.1 ± 1.4 games and 4.3 ± 2.8 days off. In a similar fashion, a 28-day non-injury baseline epoch (i.e., a random period prior to the injury epoch from the same season the injury occurred) was extracted for subsequent comparison, machine learning model training, and evaluation. To alleviate the confounding effects of unrelated factors, specific focus was given to ensure that the selected non-injury epochs started least 14 days after league breaks, player time-off, national squad training/ games or illness related absences from the teams’ training schedule. Following the time period designation, features were calculated for each of the different metrics for both injury and baseline epochs. Since our hypothesis states that excessive and/or unaccustomed exertion imposes a physiological burden on the athlete's body, thus resulting to injury, the features’ calculations intended to present the deviations from the baseline performance measurements. As such, they included an estimation of the deviation of maximum from average (DEV) and a variation of the ACWR. Specifically, DEV was designed under the premise that a single event (a divergence from the average) could trigger injury, even after a few weeks. In this regard, the average of each metric calculated for each epoch, excluding the maximum value (to avoid estimator bias). Then, the result was divided with the maximum value as presented in the equation (1) below:
 |
Equation 1 |
Where wi the value of the metric each day, n the number of observations and max is the maximum value.
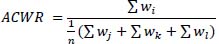
On the contrary, ACWR reflected the cumulative workload over a period of time. Generally, the ACWR describes the ratio of acute (i.e. rolling average of training load completed in the last 7 days preceding the injury) to chronic (i.e. rolling average of training load completed in the past 4 weeks) workload. Our variation diverged in the chronic workload rolling average computation, as it ignored data from the last week to calculate the average in the denominator (equation 2).
 |
Equation 2 |
Where n denotes the number of weeks, w the value of the metric each day, with the summation index i corresponding to days of week 4, j corresponding to days of week 1, k corresponding to days of week 2, and l corresponding to days of week 3
As mentioned above, the feature calculation process was utilized for each metric, resulting in 9 × 2 = 18 (metrics × features) individual samples for each of the 25 × 2 = 50 instances (subjects × epochs).
Feature selectionTo diminish variability, while highlighting the discriminatory capacity of the features, a feature selection (FS) framework was implemented. This facilitated the identification of the most pertinent features for classification, concurrently eliminating features that might exhibit redundancy in the subsequent classification procedures. On this premise, a Recursive Feature Elimination method incorporating Correlation Bias Reduction (RFE-CBR) was employed to assess interdependencies among features (Yan and Zhang, 2015). In brief, the RFE-CBR FS involves a backward elimination process, commencing with a complete feature set. It evaluates the influence of each feature and sequentially removes the one with the least effect from the feature space (based on the coefficients obtained from an internal Support Vector Machines (SVM) model). Additionally, it identifies highly correlated features to mitigate correlation bias, discerning features with substantial correlation and addressing potential underestimation of their significance. As the algorithm converges, a ranked feature space is established by sorting all features in reverse order of exclusion. To ensure that the FS (and subsequent classification) procedure would discern features invariant to individual subjects that encapsulate global information related to workload and injury, a leave-one-(subject)-out cross-validation (LOOCV) process was implemented. As such, in each iteration the data of one participant (comprising both epochs) were excluded, and the RFE-CBR FS was implemented on the remaining dataset. This process yielded 25 FS rankings. Then an overall FS ranking index was estimated by a repetitive process, incorporating, one at a time, the most frequently shared feature across all folds. In detail, this process commenced with an empty feature set, where the first subset included the most common feature in the top rank of the FS ranking sets. Subsequently, each subsequent subset expanded to include the two most common features in the first two ranks, and so forth.
ClassificationClassification utilized an SVM classifier with a Radial Basis Function kernel (RBF) under the same LOOCV design (Wang, 2005). Concisely the SVM classifier aims to find a hyperplane that best separates data classes in this transformed space. The RBF kernel computes similarity between data points in a high-dimensional space, allowing SVM to effectively handle non-linear patterns. As mentioned above, in each LOOCV repetition, the data of one participant were excluded. This allowed us to allocate the remaining data points (subjects) to the training set, while the data corresponding to the excluded subject were considered the testing set. To ascertain the optimal feature subset, classifier performance was assessed by incrementally incorporating each feature from the overall FS ranking index. Performance was evaluated using classification accuracy (the average accuracy across all folds), retaining the feature subset yielding the highest performance for further analysis. In the process of parameter refinement, we systematically adjusted the soft-margin regularization parameter (box constraint) C, utilizing a geometric sequence ranging from 10-2 to 102 with a factor of 10. Additionally, we manipulated the Kernel Scale within the radial basis function (RBF) kernel, analogous to the sigma parameter, across the interval of 0.5 to 4, employing increments of 0.5. Optimal values were set to C = 10 and Kernel Scale = 2. To mitigate potential selection bias or overtraining, we conducted 1000 permutation tests under the same LOOCV procedure, wherein class labels were randomized. Subsequently, an empirical distribution of classification accuracies was estimated, and a p-value was computed to represent the probability of the randomized samples outperformed the SVM-RBF classifier (Golland et al., 2005). All FS and classification algorithms were implemented using customized codes, the Feature Selection Library and the LIBSVM toolboxes in MATLAB 2022b (Mathworks Inc., Natick, MA, USA)(Chang and Lin, 2011; Roffo and Melzi, 2017). A scematic of the poporsed methodology is presented in Figure 2.
ValidationTo investigate the validity of our methods we further evaluated additional feature extraction and classification methods as described below. The results of our validation procedures are presented in the results section. Alternative hypothesis evaluation: To further validate our initial feature calculation hypothesis (i.e., that the inclusion of the last week in the chronic workload rolling average computation might integrate estimator bias and not accurately display prominent deviation from baseline), we additionally calculated the ACWR incorporating all weeks and subsequently duplicated the aforementioned FS and classification processes. Additional classifiers evaluation: To assess the global discriminative capacity of the selected features (assuming that the selected features would attain high classification performance despite the classifier employed), we subjected the RFE-CBR subset to multiple machine learning methods. These methods encompassed Linear SVM, k-Nearest Neighbor (k-NN), Linear Discriminant Analysis (LDA), and Random Forest (RF) classifiers.
Classification PerformanceFor the assessment of injury risk (classification of injury vs. baseline epochs), we combined DEV and ACWR features. This integration led to high performance, achieving an accuracy of 0.78 (p < 0.01, 1000 permutations), sensitivity = 0.73, specificity = 0.85 (Table 2). Figure 3 presents the confusion matrix and ROC curve of the classification model. The feature set comprised 7 features in total, with 3 being DEV features (i.e, Sprints, TL score and THR 90-100) and 4 being ACWR features (i.e, DTOT, HSR, DSprint and TL score). We subsequently evaluated the separate discriminative capacity of DEV or ACWR features in injury risk assessment (described in the following section). As such, by utilizing the 3 DEV features a significantly lower accuracy of 0.62 (p < 0.05) was obtained. Conversely, relying solely on ACWR features yielded comparable accuracy (0.76, p < 0.05), although it was inferior to the performance achieved by incorporating both feature sets. The implications of the selected features are further discussed below.
Selected features analysisAs mentioned above, from the total 18 features (corresponding to 9 DEV and ACWR load metrics), 7 were selected as prominent estimators for the assessment of injury risk. The 3 DEV features were: Sprints, TL score and THR 90-100, whereas the 4 ACWR indicated DTOT, HSR, DSprint and TL score. The feature distributions are presented in Figure 4. To identify explicit patterns in the context of injury risk assessment, the selected features were investigated in terms of the differences between the baseline and injury epochs. On this premise, a paired t-test was performed on individual features. The statistical test determines if the variance between the means of two observations (in this study, baseline vs injury) diverge significantly, where each observation in one group is paired with a specific observation in the other group. However, a paired t test did not reveal any significant differences between the two classes with the exception of DEV TL score (p-value = 0.03). In a similar manner, further inspection of the differences between the epochs was performed (i.e., assessing whether the selected features demonstrate a global increase or decrease). Based on the statistical test, no significant differences could be discerned, demonstrating a large inter-subject variability on each metric. However, an increasing trend was observed in the mean values of ACWR features indicating that (on average) the values of all selected metric on the final week (i.e., the week of injury, acute) were larger than the previous (chronic) weeks. On the contrary in the baseline epoch, the measurements obtained during the last week exhibited a level of consistency with those of preceding weeks, indicating a lack of significant divergence in recorded values. The same applies in DEV, where the feature values demonstrate a decline when comparing baseline and injury epochs. Since the DEV incorporated the max value as the partitioning element in the ratio calculation, this reduction suggests that the maximum value observed during the injury epochs exceeded that of the baseline, signifying an elevated deviation from the average.
Validation ResultsAlternative Hypothesis evaluation: The classification outcomes of the proposed framework with the inclusion of the last week, presented poor performance (Table 3). This observation aligns with established expectations, as in the injury epoch, the ACWR ratio calculation was significantly affected, making large deviations (especially prior to injury, i.e. the last week) extremely challenging to be perceived. This in turn rendered the classification process ineffective. Interestingly, the FS process produced 9 features as optimal subset, 6 of which were common to our proposed framework (i.e. ACWR features: DTOT, HSR, DSprint, DEV features: Sprints, TL score, THR 90-100). Moreover, the combination of both ACWR and DEV features improves performance. However, the classification results were marginal above chance level and therefore no conclusions can be drawn with certainty. Additional classifiers evaluation: The four supplementary classifiers (SVM-Linear, k-NN, LDA, and RF) exhibited satisfactory classification performance (Table 4), suggesting the universal efficacy of the employed features. However, none surpassed the SVM-RBF in terms of classification accuracy, this observation indicates the validity of the selected features for machine learning injury risk assessment, independent of classifier-specific algorithmic methodologies.
The aim of this study was to develop a machine learning model for the assessment of injury risk in professional soccer players, using the short and longer-term deviations of external and internal load parameters from each player’s baseline values. The developed model showed high values of accuracy, sensitivity and specificity (0.78, 0.73 and 0.85, respectively), demonstrating its ability to effectively detect early indicators of injury risk using three acute and four “chronic” external and internal training load features. Specifically, it was shown that an acute increase in high speed and sprint running distance, along with increased heart rate-related metrics, may serve as reliable indicators of muscle injury risk. The use of heart-rate derived features obtained, for the first time, during all training sessions and games, highlights the importance of the individual physiological overload as a contributor to muscle injuries in soccer. To the best of our knowledge, our ML model achieved higher or comparable performance for injury risk assessment with most studies (Rossi et al., 2018; López-Valenciano et al., 2018; Ayala et al., 2019; Rommers et al., 2020; Oliver et al., 2020), with the exception of Piłka et al., 2023 who outperformed the efficacy of our methodological approach. We note that the data and features extracted are not the same in the two studies, but in all cases, they are related with injury risk assessment, enabling an indicative comparison. In fact, in the study of Piłka et al. (2023) the classes were selected between injury and not injury events (total number of 1064 epochs) On the contrary, our approach focused solely on initial occurrences of injury, taking into account the external and internal load during the month immediately preceding the injury compared to a baseline month (4 weeks). Our objective was to achieve a balance between accuracy in assessing injury risk and clarity in explaining to the practitioners which factors are most critical, linking training variables to injury events. In this regard, we hypothesized that muscle injuries are linked with “overloading”, manifested either as an isolated event (evident as a one-day outlier in training load metrics) or as a cumulative deviation from the baseline (pronounced in the week preceding the injury). Our results, in conjunction with the low p-value derived from permutation tests, show that the framework successfully identified important features without data overfitting. It is worth mentioning that contemporary methodologies, such as deep learning, could theoretically produce superior performance. Nevertheless, these approaches encode information as higher-level abstractions of the original data, posing challenges for explainability and understanding by practitioners (Zhang and Zhu, 2018; Mahmud et al., 2018). Our goal was not only to achieve high classification performance but also to identify variables related to injury risk and may be controlled by coaches. Additionally, alternative classification methods (i.e., k-NN, SVM Linear, LDA, and RF classifiers) were employed to estimate overall optimal performance. Although these classifiers were inferior to the SVM-RBF in terms of classification accuracy, their performance demonstrated a satisfactory level (Table 4). This suggests the general applicability of the selected features for injury risk assessment, with classification validity transcending specific algorithmic procedures. Concerning the selected features, high accuracy was achieved using just the ACWR features, while, in contrast, the use of only the DEV features resulted in a decrease in accuracy to 0.62. It is important to note that our model utilized non-differentiated classification of muscle injuries without accounting for their severity or specific nature. From this standpoint, a complete exclusion of these variables could be applied in favor of prioritizing the incorporation of more discriminative information. Nevertheless, our findings demonstrate that the combination of DEV and ACWR features, enhanced the performance of the employed classifiers. From a technical viewpoint, it is plausible to hypothesize that classification performance could be increased by conducting feature selection separately on ACWR and DEV features and then integrating them into a unified feature set. However, considering the fact that the RFE-CBR FS procedure also assesses correlation bias, the unified feature set could encompass uncalculated bias, compromising the reliability of the classification processes (Toloşi and Lengauer, 2011). The discriminative ACWR features included DTOT, HSR, DSprint, while DEV features included Sprints, TL score and THR 90-100. The emergence of these features as important variables in injury risk assessment may be related to playing position of the players included in this study. Specifically, 72% of the players were midfielders and full backs, who cover on average, significantly greater total and high speed running distance compared to other positions (e.g. >10.6 km on average per match) (Poli et al., 2021). Also, the inclusion of two metrics containing heart rate data, (TL score and THR 90-100), would suggest for the first time that the physiological and metabolic overload related to increased cardiorespiratory stress may contribute to muscle injuries. It is important to note, however, that more extensive datasets incorporating a diverse range of player positions may identify distinct features as more prominent for injury risk assessment for each specific playing position. The importance and the contribution of each ACWR and DEV feature to the model's decision (injury risk assessment) is not as straightforward as in certain other models, such as linear regression (Saarela and Jauhiainen, 2021). For example, by using paired-t test, only DEV TL score was found to display significant differences with the baseline epoch (Fig. 4). However, our ML model evaluates the features’ importance based on the SVM weights (calculated by the integrated classifier), demonstrating that a simple statistical approach (i.e. p-values) is ineffective in detecting the risk assessment power of a variable. Regarding the question whether "cut-off points" for individual variables (e.g., a player surpassing a specific limit in sprint distance is prone to injury) may be used as a practical approach for identifying injury risk factors, our analysis shows that this is not advisable. This is because SVMs work by finding a decision boundary that best separates different classes in the feature space, while using a non-linear kernel (RBF in this study) makes it harder to interpret feature importance because the decision boundary is based on the kernel transformation (Wang, 2005). To further assess the validity of the selected features regarding our initial hypothesis, the validation procedure included a replication of the complete methodology with the original ACWR calculation (i.e. taking into account the current week in the calculation), instead of our variation. The rationale behind this is that since injury epochs end at the week the injury occurred, excessive load would be evident immediately before the injury (i.e., the last week) in the form of outliers (data points that significantly differ from the rest of the dataset). On this premise, by incorporating these values in the chronic workload rolling average computation, the ratio between the last week and average value of the 4 weeks (3 preceding weeks plus the last week) would be minimized and would thus fail to capture notable deviations from the baseline. As such, the validation results presented poor performance (marginal above chance level), indicating estimator bias. In fact, for the chronic average calculation the presence of outliers could distort the calculation of the mean (average) (Aguinis et al., 2013). Outliers, due to the significant difference from the rest of the dataset, can disproportionately influence the mean pulling it in the direction of the extreme values. This can result in a mean that does not accurately represent the central tendency (typical value) of the majority of the data, leading to a biased estimate. To address this issue, we excluded the last week when calculating the chronic workload average. By excluding the last week's data, any outliers or extreme values from that period have less impact on the overall chronic average. This exclusion ensures that the chronic workload average reflects the more stable and typical training load over a more extended period, providing a more reliable baseline for comparison with the acute workload. Another noteworthy aspect of the validation results is that, utilizing solely DEV features (where no recalculation took place) classification accuracy dropped significantly (from 62% to 54%). This was attributed to the inclusion of an additional DEV feature (i.e., Dec) that could introduce noise rather than useful information, thus excessively tuning to the intricacies of the training data (capturing noise and outliers) but failing to generalize effectively to the testing (new, unseen) data (Vento and Fanfarillo, 2019). Although the features selected exhibited satisfying performance, caution should be exercised regarding their interpretation, particularly concerning the load factors related to injuries. The primary consideration is that the FS procedure only determines which features are important for classification, but not how they relate to load-related injuries. Some features might be included or excluded to reduce data noise and improve performance without directly showing their connection to training load and injuries (Haufe et al., 2014). As such, no significant increment or decline in feature values could be observed, implying high subject variability. Subsequent examination of the features supported these findings, with a subset of participants (52% - 60%) demonstrating an increase in ACWR features, while the remaining participants exhibited a decline. Similar trends were observed in the case of DEV features, with 44% - 72% of the overall subjects displaying a decrease. This is corroborated by other studies suggesting that training load metrics can diverge greatly between individuals, age, player’s position and dissimilarities in effort and competence (Hills and Rogerson, 2018; Akyildiz et al., 2022). However, the robust performance exhibited by the RFE-CBR selected features (irrespective of the employed classifier, as mentioned above), suggests intrinsic characteristics as dependable indicators of training load injury. Furthermore, the integration of ACWR and DEV representations, despite their dissimilarity, holds the potential to validate the associations between single-event and cumulative workload in the context of sports injuries. Another notable constraint in this study is the indiscriminate categorization of injuries without considering their severity or type. Hence, it is hypothesized that initial non-contact injuries may be attributed to training load without accounting for additional factors such as heat stress, or dehydration, which have the potential to compromise physical performance by impacting endurance, strength, and speed. Moreover, in key matches, local anesthetics or corticosteroids, may be administered to alleviate pain or reduce inflammation temporarily. This enables players to continue participating in a match despite an injury, mislabeling them as uninjured and thus introducing bias in the machine learning processes. The limited size of the data (25 players) could also have introduced a potential bias towards population representation (since all players were from the same team, under the same or similar training methods). As such, generalization of our results towards a universal application should be approached with caution. To address this concern, we suggest that future studies should enhance both the experimental and methodological facets outlined in this manuscript by augmenting the dataset size. Also, static features (such as fitness test data) and subjective training load reports from athletes should be integrated to the model to further increase the performance of injury risk assessment. Machine learning methods were used to assess the risk of muscle injuries in professional soccer based on training load analysis. The developed model demonstrated an accuracy of 0.78, sensitivity of 0.73, and specificity of 0.85, highlighting its effectiveness in identifying early signs of injury risk, based on seven external and internal training load features (three acute and four “chronic”). Importantly, this study showed that a surge in fast running (HSR and sprints), combined with increased physiological and metabolic overload indicated by increased heart rate-related internal load metrics, may contribute to muscle injuries. These findings may be used to further develop a methodology based on training load analysis with the addition of other features, such as strength and endurance measurements, aiming to reduce the incidence of muscle injuries in soccer. By identifying the important training load parameters, coaches may aim to control unnecessary surges of their values during short and longer training periods. Also, optimal training programs based on these findings can potentially reduce injury risks and promote athlete well-being and performance sustainability in professional soccer.
| ACKNOWLEDGEMENTS |
The measurement complied with the current laws of the country in which they were performed. The authors have no conflicts of interest to declare. The datasets generated and analyzed during the current study are not publicly available, but are available from the corresponding author who was an organizer of the study. |
|
| AUTHOR BIOGRAPHY |
|
 |
Theodoros Tsilimigkras |
| Employment: Biomedical Engineering Laboratory, National Technical University of Athens, Greece, |
| Degree: MSc |
| Research interests: Performance & Tactical Analysis, Predictive Modeling, Advanced Data analysis, Visualization and reporting |
| E-mail: thtsilim@gmail.com |
| |
 |
Ioannis Kakkos |
| Employment: Biomedical Engineering Laboratory, National Technical University of Athens, Greece |
| Degree: PhD |
| Research interests: transmission of nerve stimuli, the study of cognitive systems and processes, algorithmic applications for medical image and signal processing and the development of AI techniques for diagnosis and therapy |
| E-mail: ikakkos@biomed.ntua.gr |
| |
 |
George K. Matsopoulos |
| Employment: Biomedical Engineering Laboratory, National Technical University of Athens, Greece |
| Degree: PhD |
| Research interests: nonlinear image processing applied to medical applications, 2-D and 3-D registration of medical images, computer vision applications, medical decision support systems, and Web-based medical systems for telemedicine application and remote image processing |
| E-mail: gmatsopoulos@biomed.ntua.gr |
| |
 |
Gregory C. Bogdanis |
| Employment: School of Physical Education and Sport Science, National and Kapodistrian University of Athens, Greece |
| Degree: MSc, PhD |
| Research interests: Sport and Exercise Training, High intensity interval training, muscle metabolism, fatigue, resistance and power training, training load management, soccer physiology and nutrition |
| E-mail: gbogdanis@phed.uoa.gr |
| |
|
| |
| REFERENCES |
 Aguinis H., Gottfredson R.K., Joo H. (2013) Best-Practice Recommendations for Defining, Identifying, and Handling Outliers. Organizational Research Methods 16, 270-301. Crossref |
Akenhead R., Nassis G.P. (2016) Training Load and Player Monitoring in High-Level Football: Current Practice and Perceptions. International Journal of Sports Physiology and Performance 11, 587-593. Crossref |
Akyildiz Z., de Oliveira Castro H., Çene E., Laporta L., Parim C., Altundag E., Akarçe?me C., Guidetti G., Miale G., Silva A. F., Nobari H., Clemente F. M. (2022) Within-week differences in external training load demands in elite volleyball players. BMC Sports Science, Medicine and Rehabilitation 14, 188. Crossref |
Ayala F., López-Valenciano A., Gámez Martín J.A., De Ste Croix M., Vera-Garcia F.J., García-Vaquero M.D.P., Ruiz-Pérez I., Myer G. D. (2019) A Preventive Model for Hamstring Injuries in Professional Soccer: Learning Algorithms. International Journal of Sports Medicine 40, 344-353. Crossref |
Bourdon P.C., Cardinale M., Murray A., Gastin P., Kellmann M., Varley M.C., Gabbett T. J., Coutts A. J., Burgess D. J., Gregson W., Cable N. T. (2017) Monitoring Athlete Training Loads: Consensus Statement. International Journal of Sports Physiology and Performance 12, 2161-2170. Crossref |
Bowen L., Gross A.S., Gimpel M., Bruce-Low S., Li F.-X. (2020) Spikes in acute:chronic workload ratio (ACWR) associated with a 5-7 times greater injury rate in English Premier League football players: a comprehensive 3-year study. British Journal of Sports Medicine 54, 731-738. Crossref |
Chang C.C., Lin C.J. (2011) LIBSVM: A library for support vector machines. ACM Transactions on Intelligent Systems and Technology 2, 1-27. Crossref |
Claudino J.G., Capanema D. de O., de Souza T.V., Serrão J.C., Machado Pereira A.C., Nassis G.P. (2019) Current Approaches to the Use of Artificial Intelligence for Injury Risk Assessment and Performance Prediction in Team Sports: a Systematic Review. Sports Medicine - Open 5, 28. Crossref |
Ehrmann F.E., Duncan C.S., Sindhusake D., Franzsen W.N., Greene D.A. (2016) GPS and Injury Prevention in Professional Soccer. Journal of Strength and Conditioning Research 30, 360-367. Crossref |
Gabbett T.J. (2010) The development and application of an injury prediction model for noncontact, soft-tissue injuries in elite collision sport athletes. Journal of Strength and Conditioning Research 24, 2593-2603. Crossref |
Gabbett T.J. (2016) The training-injury prevention paradox: should athletes be training smarter and harder?. British Journal of Sports Medicine 50, 273-280. Crossref |
Gabbett T.J., Hulin B.T., Blanch P., Whiteley R. (2016) High training workloads alone do not cause sports injuries: how you get there is the real issue. British Journal of Sports Medicine 50, 444-445. Crossref |
Gabbett T.J., Nassis G.P., Oetter E., Pretorius J., Johnston N., Medina D., Rodas G., Myslinski T., Howells D., Beard A., Ryan A. (2017) The athlete monitoring cycle: a practical guide to interpreting and applying training monitoring data. British Journal of Sports Medicine 51, 1451-1452. Crossref |
Golland, P., Liang, F., Mukherjee, S. and Panchenko, D. (2005) Permutation Tests for Classification. In: Learning Theory. Lecture Notes
in Computer Science. Eds: Auer, P. and Meir, R. Berlin, Heidelberg: Springer. 501-515. Crossref |
Haufe S., Meinecke F., Görgen K., Dähne S., Haynes J.-D., Blankertz B. (2014) On the interpretation of weight vectors of linear models in multivariate neuroimaging. NeuroImage 87, 96-110. Crossref |
Hills S.P., Rogerson D.J. (2018) Associatons Between Self-Reported Well-being and Neuromuscular Performance During a Professional Rugby Union Season. The Journal of Strength & Conditioning Research 32, 2498. Crossref |
Hurley O.A. (2016) Impact of Player Injuries on Teams’ Mental States, and Subsequent Performances, at the Rugby World Cup 2015. Frontiers in Psychology 7, 807. Crossref |
Hägglund M., Waldén M., Magnusson H., Kristenson K., Bengtsson H., Ekstrand J. (2013) Injuries affect team performance negatively in professional football: an 11-year follow-up of the UEFA Champions League injury study. British Journal of Sports Medicine 47, 738-742. Crossref |
Jaspers A., De Beéck T.O., Brink M.S., Frencken W.G.P., Staes F., Davis J.J., Helsen W. F. (2018) Relationships Between the External and Internal Training Load in Professional Soccer: What Can We Learn From Machine Learning?. International Journal of Sports Physiology and Performance 13, 625-630. Crossref |
Kalkhoven J.T., Watsford M.L., Coutts A.J., Edwards W.B., Impellizzeri F.M. (2021) Training Load and Injury: Causal Pathways and Future Directions. Sports Medicine (Auckland, N.Z.) 51, 1137-1150. Crossref |
Khezri D., Abbasi H., Nobari H. (2022) Training Loads and Non-Contact Injuries in Soccer: A Full Season Monitoring of a Team in Iranian Premier League. Studies in Sport Medicine 14, 45-64. |
Kumar G.S., Kumar M.D., Reddy S.V.R., Kumari B.V.S., Reddy C.R. (2024) Injury Prediction in Sports using Artificial Intelligence Applications: A Brief Review. Journal of Robotics and Control (JRC) 5, 16-26. Crossref |
López-Valenciano A., Ayala F., Puerta Jos.M., DE Ste Croix M.B.A., Vera-Garcia F.J., Hernández-Sánchez S., Ruiz-Pérez I., Myer G. D. (2018) A Preventive Model for Muscle Injuries: A Novel Approach based on Learning Algorithms. Medicine and Science in Sports and Exercise 50, 915-927. Crossref |
Mahmud M., Kaiser M.S., Hussain A., Vassanelli S. (2018) Applications of Deep Learning and Reinforcement Learning to Biological Data. IEEE Transactions on Neural Networks and Learning Systems 29, 2063-2079. Crossref |
Nassis G.P., Massey A., Jacobsen P., Brito J., Randers M.B., Castagna C., Mohr M., Krustrup P. (2020) Elite football of 2030 will not be the same as that of 2020: Preparing players, coaches, and support staff for the evolution. Scandinavian Journal of Medicine & Science in Sports 30, 962-964. Crossref |
Nassis G.P., Verhagen E., Brito J., Figueiredo P., Krustrup P. (2023) A review of machine learning applications in soccer with an emphasis on injury risk. Biology of Sport 40, 233-239. Crossref |
Noya Salces J., Gomez-Carmona P.M., Moliner-Urdiales D., Gracia-Marco L., Sillero-Quintana M. (2014) An examination of injuries in Spanish Professional Soccer League. The Journal of Sports Medicine and Physical Fitness 54, 765-771. |
Oliver J.L., Ayala F., De Ste Croix M.B.A., Lloyd R.S., Myer G.D., Read P.J. (2020) Using machine learning to improve our understanding of injury risk and prediction in elite male youth football players. Journal of Science and Medicine in Sport 23, 1044-1048. Crossref |
Piłka T., Grzelak B., Sadurska A., Górecki T., Dyczkowski K. (2023) Predicting Injuries in Football Based on Data Collected from GPS-Based Wearable Sensors. Sensors 23, 1227-. Crossref |
Pillitteri G., Petrigna L., Ficarra S., Giustino V., Thomas E., Rossi A., Clemente F. M., Paoli A., Petrucci M., Bellafiore M., Palma A., Battaglia G. (2023) Relationship between external and internal load indicators and injury using machine learning in professional soccer: a systematic review and meta-analysis. Research in Sports Medicine (Print) , 1-37. Crossref |
Poli D.R., Ravenel L., Besson R. (2021) Analysis of the distances covered in professional football competitions. CIES Football Observatory Monthly Report n°68 , -. |
Raya-González J., Pulido J.J., Beato M., Ponce-Bordón J.C., López del Campo R., Resta R., García-Calvo T. (2022) Analysis of the Effect of Injuries on Match Performance Variables in Professional Soccer Players: A Retrospective, Experimental Longitudinal Design. Sports Medicine - Open 8, 31. Crossref |
Roffo, G. and Melzi, S. (2017) Ranking to Learn: Feature ranking and
selection via eigenvector centrality. In: New Frontiers in Mining
Complex Patterns. Lecture Notes in Computer Science. Eds: Appice, A., Ceci, M., Loglisci, C., Masciari, E. and Ra?, Z.W.
Cham: Springer International Publishing. 19-35. Crossref |
Rogalski B., Dawson B., Heasman J., Gabbett T.J. (2013) Training and game loads and injury risk in elite Australian footballers. Journal of Science and Medicine in Sport 16, 499-503. Crossref |
Rommers N., Rössler R., Verhagen E., Vandecasteele F., Verstockt S., Vaeyens R., Lenoir M., D’Hondt E., Witvrouw E. (2020) A Machine Learning Approach to Assess Injury Risk in Elite Youth Football Players. Medicine and Science in Sports and Exercise 52, 1745-1751. Crossref |
Rossi A., Pappalardo L., Cintia P. (2021) A Narrative Review for a Machine Learning Application in Sports: An Example Based on Injury Forecasting in Soccer. Sports (Basel, Switzerland) 10, 5. Crossref |
Rossi A., Pappalardo L., Cintia P., Iaia F.M., Fernàndez J., Medina D. (2018) Effective injury forecasting in soccer with GPS training data and machine learning. Plos One 13, e0201264. Crossref |
Saarela M., Jauhiainen S. (2021) Comparison of feature importance measures as explanations for classification models. SN Applied Sciences 3, 272. Crossref |
Silva H., Nakamura F.Y., Beato M., Marcelino R. (2023) Acceleration and deceleration demands during training sessions in football: a systematic review. Science & Medicine in Football 7, 198-213. Crossref |
Suarez-Arrones L., De Alba B., Röll M., Torreno I., Strütt S., Freyler K., Ritzmann R. (2020) Player Monitoring in Professional Soccer: Spikes in Acute:Chronic Workload Are Dissociated From Injury Occurrence. Frontiers in Sports and Active Living 2. Crossref |
Toloşi L., Lengauer T. (2011) Classification with correlated features: unreliability of feature ranking and solutions. Bioinformatics 27, 1986-1994. Crossref |
Van Eetvelde H., Mendonça L.D., Ley C., Seil R., Tischer T. (2021) Machine learning methods in sport injury prediction and prevention: a systematic review. Journal of Experimental Orthopaedics 8, 27. Crossref |
Vento, D.D. and Fanfarillo, A. (2019) Traps, Pitfalls and Misconceptions
of Machine Learning applied to Scientific Disciplines. In: Proceedings of the Practice and Experience in Advanced Research
Computing on Rise of the Machines (learning). PEARC ’19.
New York, NY, USA: Association for Computing Machinery. 1-8. Crossref |
Wang L. (2005) Support Vector Machines: Theory and Applications. Springer Science & Business Media. Crossref |
Yan K., Zhang D. (2015) Feature selection and analysis on correlated gas sensor data with recursive feature elimination. Sensors and Actuators B: Chemical 212, 353-363. Crossref |
Zhang Q., Zhu S. (2018) Visual interpretability for deep learning: a survey. Frontiers of Information Technology & Electronic Engineering 19, 27-39. Crossref |
|
| |
|
|
|
|


